
Mastering the Symmetrical Triangle Chart Pattern and Smart Money Concept (SMC) in Forex Trading
Increase Your Trading Performance in 2025 and Beyond with the Symmetrical Triangle Chart Pattern and Smart Money Concept (SMC).
In this lesson, we will reveal how you can combine the Smart Money Concept (SMC) with the Symmetrical Triangle chart pattern to elevate your trading journey and make consistent, profitable trade entries in the financial market.
The Symmetrical Triangle chart pattern is one of the most powerful chart patterns that has helped professional traders capture profitable opportunities in the forex market. For instance, in 2024, a significant setup occurred with the EUR/USD pair where a clear symmetrical triangle formation predicted a substantial breakout, resulting in a 150-pip move over the course of several days. Similarly, the GBP/JPY pair showcased this pattern, leading to a successful upward breakout reflecting the precision and reliability of this chart pattern. As a beginner, once you master the skill of identifying this pattern with ease, you will start making better and more profitable trades. But when you combine it with the Smart Money Concept, the results become even more powerful and consistent. On its own, the Symmetrical Triangle is effective, but when paired with SMC, the outcome is massive; it’s like adding fuel to the fire.
As a beginner in the forex market, it is important to understand that no strategy works 100% of the time. Trading is based on probabilities, not guarantees. There is no “holy grail” strategy in the financial market. This is why you must practice, master, and develop personal skills around any trading method with a demo account before investing real money. Forex trading carries significant financial risk when you don’t know what you’re doing. If you are not profitable on a demo account, you will not suddenly become profitable in a live market with real capital. Always ensure you are well-prepared before entering live trading.
Why Combine the Symmetrical Triangle Chart Pattern with SMC?
The answer is simple: it increases profitability and precision. By taking precise entries in the market, you minimize risk and maximize potential returns. This reduces the size of your stop-loss while increasing your profit target.
The Symmetrical Triangle pattern is effective when traded alone, but combining it with SMC entry models such as order blocks, Fair Value Gaps (FVGs), ICT Breakaway Gaps, and liquidity levels makes it even more powerful. SMC allows you to see what institutional traders, such as Smart Money players, are doing in the market. It gives you insight into their footprints and helps you position your trades for better results.
Another major advantage is that SMC helps you identify fakeouts, protecting you from being trapped by big players who often use retail traders as liquidity. With SMC, you stop taking blind trades and start aligning with institutional moves, which significantly boosts your trading success. If you are new to SMC, you can start our free master class to gain quality knowledge on how it works.
What Is a Symmetrical Triangle Chart Pattern?
The Symmetrical Triangle chart pattern is a trend continuation or reversal pattern that forms when the market consolidates, creating a series of lower highs and higher lows. This results in two trendlines that converge towards each other, forming a triangle shape.
Here’s what you need to understand:
- The pattern shows indecision in the market; buyers and sellers are in a tug-of-war.
- Volume usually decreases as the triangle narrows.
- A breakout typically occurs when the price breaks either the upper or lower trendline.
- Most of the time, the breakout continues in the direction of the prevailing trend before the triangle is formed.
The beauty of this pattern is that it helps traders anticipate explosive moves after consolidation.
Symmetrical Triangle vs Pennant Chart Pattern
At first glance, beginners often confuse the Symmetrical Triangle with the Pennant chart pattern because both look quite similar. However, they are not the same. Here are the key differences:
- Formation Context
- A Pennant forms after a strong price move (flagpole), followed by consolidation in a small triangular shape before continuation.
- A Symmetrical Triangle forms during consolidation without a prior sharp move; it reflects market indecision over a longer period.
- Size and Duration
- Pennants are short-term patterns, usually lasting a few days to a couple of weeks.
- Symmetrical Triangles can form over weeks or even months, making them longer-term continuation patterns.
- Signal Strength
- Pennants usually indicate quick continuation after the breakout.
- Symmetrical Triangles often signal larger, more explosive moves after extended consolidation.
In simple terms, a Pennant is like a quick pause after a sprint, while a Symmetrical Triangle is like building up energy before a big move.
Why the Symmetrical Triangle Chart Pattern Is Powerful for Beginners
- It’s easy to spot on the chart once you train your eyes. As a beginner, practice identifying this pattern within 30 seconds on various timeframes to build your recognition skills quickly.
- It works across all timeframes, from scalping on the 5-minute chart to swing trading on the daily chart. It gives traders a clear breakout level (above or below the triangle), providing a defined risk and entry point.
- It allows for tight stop-loss placements, reducing risk while maximizing reward. This can be achieved by mastering swift pattern identification and stop-loss setting techniques.
- However, beginners should remember that no pattern works 100% of the time. Stating measurable goals, such as pattern recognition speed and precise stop-loss placements, is crucial here. This is why combining it with Smart Money Concept (SMC) entry models is a game-changer, ensuring consistent learning and performance improvement.
Combining Symmetrical Triangle with Smart Money Concept (SMC)
The Smart Money Concept teaches us to trade like institutional traders (hedge funds, banks, big money players). These players leave footprints in the market, and if you know how to read them, you can position your trades for success.
When you combine the Symmetrical Triangle breakout with SMC entry models, you avoid false breakouts and enter trades with precision. Let’s break it down:
1. Order Blocks
- Definition: Areas where institutions place large orders, usually before big moves.
- Application: Wait for the Symmetrical Triangle breakout. Then check if the breakout aligns with a nearby bullish or bearish order block. If it does, that breakout is more likely to hold.
2. Fair Value Gaps (FVGs)
- Definition: Imbalances in price action where one side (buyers or sellers) dominates without resistance.
- Application: After the breakout, look for an FVG in the same direction. If price retraces into the FVG to mitigate it, you have a high-probability entry confirmation.
3. ICT Breakaway Gaps
- Definition: Similar to FVGs but specifically marks institutional footprints where price aggressively moves away from a level, leaving gaps.
- Application: If a breakout from the Symmetrical Triangle also creates or aligns with a Breakaway Gap, that’s a strong sign of institutional participation.
4. Liquidity
- Definition: Levels where retail traders place stop-losses (above highs, below lows).
- Application: Before the real breakout, institutions often create fakeouts to grab liquidity. Combining SMC with the Symmetrical Triangle helps you avoid these traps. Always wait for liquidity sweeps before entering the breakout direction.
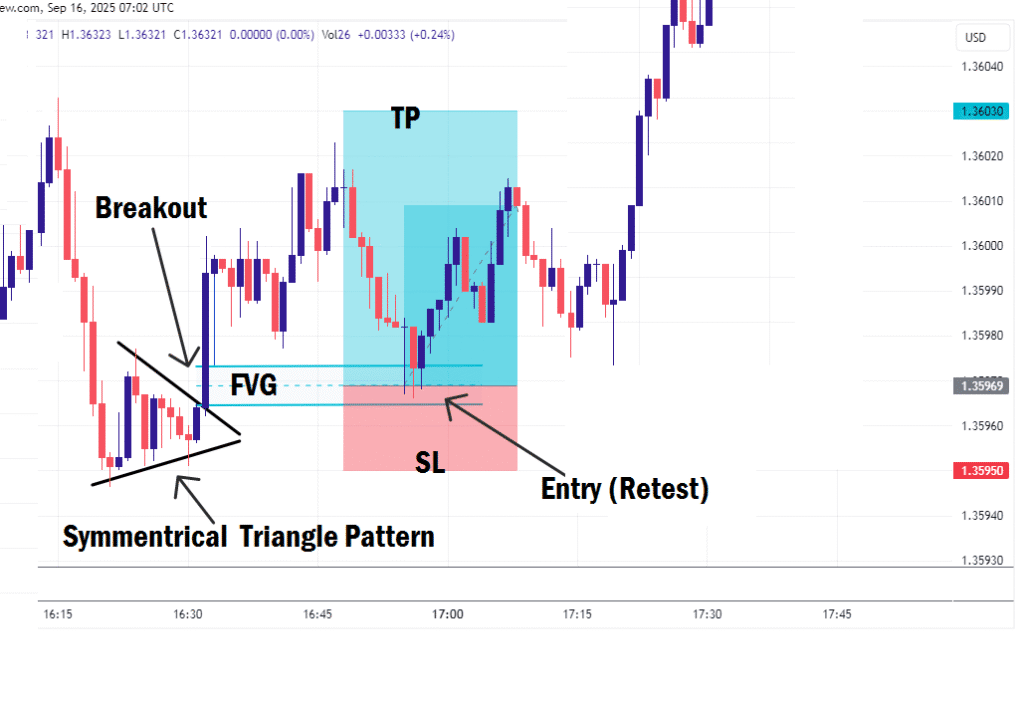
Step-by-Step Trading Approach in a Bullish Scenario
- Identify the Symmetrical Triangle: Draw your converging trendlines.
- Wait for Breakout: Don’t enter early. Because price can break out from either side, you need to wait for the breakout to confirm.
- Check SMC Models: Confirm breakout with Order Blocks, FVGs, ICT Breakaway Gaps, or liquidity grabs.
- Set Entry and Stop-Loss: Enter when price pulls back to mitigate the FVG or breakaway gap it creates as a result of the breakout. This should be during the retest phase. Place a stop-loss (SL) just below the order block that caused the FVG or breakaway gap during the breakout.
- Take-profit (TP): Use recent liquidity levels or target at least two to three times the size of your stop-loss or more.
This entry model is also applicable to a bearish scenario. If the breakout happened in the bearish direction, use the same entry method in a bearish way. The bullish breakout presents a buy opportunity, while the bearish breakout offers a sell opportunity.
Final Thoughts
The Symmetrical Triangle chart pattern is a powerful tool on its own, but when you combine it with Smart Money Concept entry models, it becomes a high-probability trading strategy. It helps beginners not only trade breakouts with confidence but also avoid the traps that institutions set in the market.
Always remember: trading is about probabilities, not certainties. Practice identifying these setups on a demo account, backtest them, and once you build confidence, you can step into the live market with a clear edge.
If you want to succeed in forex trading in 2025 and beyond, master the art of combining technical chart patterns with institutional concepts like SMC; that’s how you stay ahead of the crowd.
If you have further questions about this topic or need us to look into a specific topic for you, let us know in the comments section. Trade wisely.


