
Understanding Candlestick Types in Forex
Among all chart types used in the forex market, the candlestick chart stands out as the most popular and widely used. Almost every professional forex trader relies on candlestick charts to analyze market behavior and make informed trading decisions.
When you open your broker’s trading platform or log into your default TradingView chart, the first thing you’ll see is usually a candlestick chart. You might be wondering, “Why do traders prefer candlestick charts over line charts, bar charts, or other types of charts?”
Don’t worry! In this lesson, we’ll take you beyond the basics and help you understand everything you need to know about candlesticks as a beginner forex trader.
Why Do Traders Choose Candlestick Charts Over Other Chart Types?
Let’s break it down in simple terms. Candlestick charts give you more visual information about price movement in every time frame. They show you:
- Rejections, represented by the wicks of the candles
- Trading volume, represented by the candle body
Using candlestick charts, you can easily identify when price rejection is occurring at key levels, a potential sign of a market reversal.
The origin of candlestick charts can be traced back to the 18th century, created by a Japanese rice trader named Munehisa Homma. These charts were later introduced to the Western world by Steve Nison in his book Japanese Candlestick Charting Techniques, published in 1991.
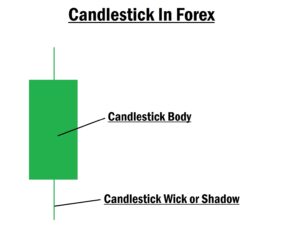
A Candlestick Is Divided Into Two Key Parts:
- The Body – This shows the trading volume and the difference between the opening and closing price.
- The wick (or Shadow) – This shows price rejection and market volatility.
The Two Major Types of Candlesticks in the Forex Chart
In the forex market, you’ll typically see two main types of candlesticks on your chart. These two types form the foundation of price movement in the market.
By default, you will see:
- Green Candles – Bullish candles showing a rise in price
- Red Candles – Bearish candles showing a drop in price
You can customize these colors, but their meaning remains the same.
How Does a Candlestick Open and Close?
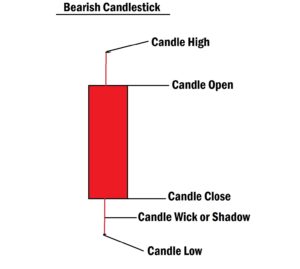
The opening and closing of a candlestick help you determine whether it’s bullish or bearish, even if the default colors are changed.
- A bearish candlestick opens at the top and closes lower than it opened. For example, if a candle opens at 1.0005 and closes at 1.0001, it’s a bearish candle.
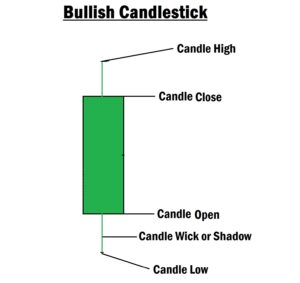
- A bullish candlestick opens at the bottom and closes higher than its opening price. For example, if it opens at 1.0001 and closes at 1.0005, it’s bullish.
Every new candlestick opens at the price where the previous one closed. It applies across all time frames, from the 1-minute to the daily chart. Observe the 1-minute chart closely, and you’ll gain deeper insight into how price action works in the forex market.
Single Candlestick Patterns You Should Know
Each candlestick represents the trading activity within its time frame. For example:
- On the 1-minute chart, one candlestick forms every minute.
- On the 1-hour chart, one candlestick represents an hour’s worth of trading activity.
The forex chart is fractal. It means that what you see on the 1-minute chart is reflected similarly in other time frames.
You’ll notice different candlestick patterns on your chart, some with long wicks, some with long bodies, and others with no wicks at all. This is how it is across all time frames. These candlestick shapes have names and meanings.
Here are the eight major single candlestick patterns you should know:
- Doji
- Marubozu
- Hammer
- Hanging Man
- Gravestone Doji
- Inverted Hammer
- Spinning Top
- Dragonfly Doji
1. Doji Candlestick in Forex Chart
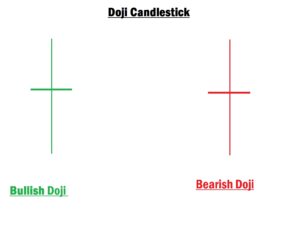
A Doji forms when the opening and closing prices are nearly the same. This pattern signals indecision in the market, showing that neither buyers nor sellers are in control. You can spot a Doji in any time frame, and it always represents market hesitation.
2. Marubozu Candlestick in Forex Chart
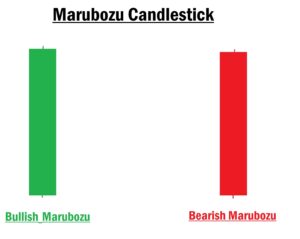
The Marubozu is a long-bodied candlestick with little or no wicks. It appears when there’s strong buying or selling pressure.
- A bearish Marubozu at a resistance level indicates sellers are gaining control.
- A bullish Marubozu at a support level suggests buyers are stepping in.
However, avoid using Marubozu candles alone for confirmation. Combine them with other reversal signals before placing your trade.
3. Hammer or Pin Bar Candlestick in Forex Chart
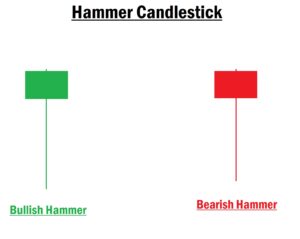
The Hammer, also known as a Pin Bar, is a bullish reversal candlestick with:
- A small body at the top
- A long lower wick (rejection tail)
This pattern signals the end of a downtrend, especially when found at a key support zone. Confirm with other indicators before entering the trade.
4. Hanging Man Candlestick in Forex Chart
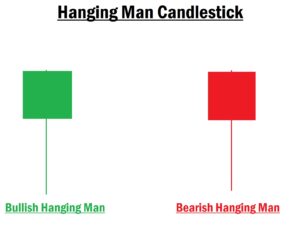
The Hanging Man is a bearish reversal candlestick that forms after an uptrend. It has:
- A small body at the top
- A long lower wick
This pattern indicates a potential drop in price, especially when spotted at a resistance zone. Always wait for confirmation before placing a sell order.
5. Gravestone Doji in Forex Chart
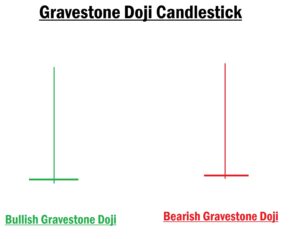
The Gravestone Doji is a bearish reversal candlestick with:
- A long upper wick
- Little or no body and a short lower wick
It often appears at the end of an uptrend, signaling that sellers are starting to take control. However, do not use it as a standalone confirmation.
6. Inverted Hammer Candlestick in Forex Chart
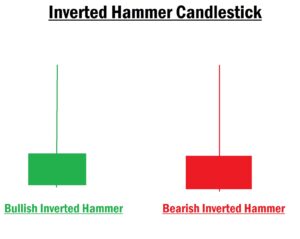
The Inverted Hammer is a bullish reversal pattern, appearing after a downtrend. It has:
- A small body
- A long upper wick
- Little or no lower wick
When spotted at a key support level, it shows sellers are losing momentum. But always confirm with other reversal tools before placing a buy order.
7. Spinning Top Candlestick in Forex
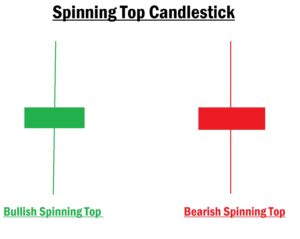
The Spinning Top features a small body with both upper and lower wicks. It’s similar to the Doji but with a slightly larger body.
This candlestick signals indecision, and you should wait for the next candle to form before making a trading decision.
8. Dragonfly Doji Candlestick in Forex
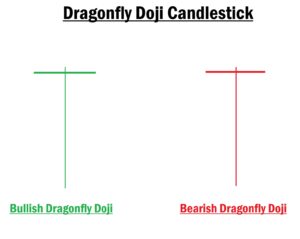
The Dragonfly Doji forms a “T” shape, with:
- A long lower wick
- No real body
- Little or no upper wick
This pattern signals a potential bullish reversal, especially when seen at a support level. But again, don’t rely on it alone. Always confirm with other tools.
Final Thoughts
Just because you spot one of these candlestick patterns doesn’t mean you should immediately enter a trade. These are reversal signals, not entry confirmations.
Always combine them with other technical indicators and your personal trading strategy before making a move.
In our next lesson, we’ll explore “Understanding Price Action in Forex Trading.”
Don’t miss it!


