
Rectangle Chart Pattern in Forex Trading: How Beginners Can Use SMC for Profitable Entries
In forex trading, the Rectangle chart pattern is one of the simplest and most reliable patterns you’ll ever come across. It appears frequently, is easy to identify, and has been helping traders catch profitable continuation trades for decades.
What makes the Rectangle chart pattern even more effective is when it’s combined with the Smart Money Concept (SMC). Together, they provide traders with high-probability setups, improved accuracy, and stronger risk-to-reward opportunities.
The beauty of the Rectangle chart pattern is its simplicity. It is one of the easiest chart patterns for beginners to recognize on the forex chart. At the same time, many professional traders rely on it to spot strong continuation setups and capitalize on institutional moves.
The Challenge with Trading Rectangle Chart Patterns
Despite its simplicity, many beginner traders face one recurring challenge: finding the right entry point. Entering too early or too late often leads to being stopped out by institutional players before the real trend move begins.
This is exactly where the Smart Money Concept (SMC) comes in. By applying SMC principles, traders can filter out false moves and pinpoint the exact zones where institutional traders are likely to enter, improving the overall win rate.
Rectangle Chart Pattern Success Rate
According to backtesting data and industry insights, the Rectangle chart pattern has a strong win rate when combined with proper risk management. While trading the pattern alone can already be profitable, combining it with SMC tools is like “adding fuel to the fire.” It significantly enhances trade quality and consistency.
Introduction to Smart Money Concept (SMC)
The Smart Money Concept (SMC) is a trading methodology that analyzes and follows the footprints of institutional traders, often referred to as “smart money.” These big players control most of the price movement in the forex market.
Because institutions trade in large volumes, they require liquidity to execute orders. This often results in price being driven into areas where retail traders place their stop losses or pending orders to trigger them. By learning to identify these manipulations, traders can align with institutional flows instead of getting trapped.
Some of the key SMC entry models include:
- Fair Value Gaps (FVGs): Price imbalances left when the market moves rapidly in one direction, leaving unfilled space on the chart.
- Order Blocks (OBs): The last bullish or bearish candle before a strong impulsive move, often used by institutions for entries.
- ICT Breakaway Gaps: Large gaps formed when price breaks out strongly from consolidation, signaling institutional presence.
- Liquidity Grab or Sweep: When smart money players drive into areas where retail traders place their stop losses or pending orders to trigger them.
By combining these tools with the Rectangle chart pattern, traders can refine their entries, especially during the retest phase after a breakout. If you’re new to SMC or still struggling with it, consider starting our free structured masterclass to understand how it works.
Why Combine Rectangle Chart Pattern with SMC?
The answer is simple: precision and profitability. Instead of guessing your entries, combining the Rectangle chart pattern with SMC allows you to:
- Identify a clear price direction from the pattern.
- Use refined entry zones through FVGs, OBs, ICT Breakaway Gaps, and liquidity sweeps.
- Avoid common retail traps and stop-hunts.
- Reduce losses, maximize profits, and trade with higher confidence.
Most beginner traders lose money because they enter at the wrong time. But with SMC, you’ll know exactly where to look for high-probability entries. Over time, this combination helps you avoid frequent stop-outs from institutional moves and steadily grow your trading account.
What is a Rectangle Chart Pattern?
The Rectangle chart pattern is a trend continuation pattern. It happens when price consolidates between two clear horizontal levels, support at the bottom and resistance at the top. During this time, price moves sideways, creating a “box” shape on the chart.
Think of it as the market taking a break or “catching its breath” before continuing in the same direction.
Types of Rectangle Chart Patterns
There are two types you’ll see:
1. Bullish Rectangle
- Forms in an uptrend.
- Price consolidates sideways.
- After the breakout, price usually retests the broken resistance level and continues upward with the trend.
2. Bearish Rectangle
- Forms in a downtrend.
- Price consolidates sideways.
- After the breakout, price usually retests the broken support level and continues downward with the trend.
Both of them are continuation patterns, meaning they usually follow the overall market direction.
How to Trade Rectangle Patterns with SMC
Here’s a simple strategy you can follow as a beginner:
Step 1: Spot the Rectangle
Look for a sideways consolidation with nearly equal highs and equal lows. Mark the support (bottom) and resistance (top).
Step 2: Wait for the Breakout
Wait for price to break out of the range. Don’t jump in immediately. Most false breakouts happen here, and that’s where retail traders get trapped. A valid breakout must sweep or grab liquidity from the opposite direction, then breakout from the other direction with momentum. The liquidity sweep shows that institutional traders are ready to continue pushing price.
Step 3: Watch the Retest + Look for SMC Signals
After the breakout, wait for price to come back and retest the broken level (old support or resistance).
Now look for:
Now look for:
- A Fair Value Gap formed around the broken level.
- An Order Block that caused the breakout.
- A Breakaway Gap confirms institutional momentum.
Your entry point should be at the fair value gap or the ICT breakaway gap.
Step 4: Place Stop Loss and Take Profit
- Stop Loss: Just below the bullish order block or support level (in bullish setup). For a bearish setup, it should be above the resistance level or bearish order block.
- Take Profit: At least 2x the size of your risk (Stop Loss). A simple way is to measure the height of the rectangle and project it from the breakout.
Example Setup
Imagine GBP/USD is in an uptrend and forms a bullish rectangle. Price grabs liquidity from the support level and breaks out above the resistance line with momentum, then comes back to retest. On that retest, a bullish order block lines up perfectly with the broken resistance level (Now used as support). Also, an FVG is found within the broken resistance level.
Your entry point is the FVG. Place a stop loss below the order block and target 2x the rectangle’s height for profit. You can also target 2 to 3 times the size of your stop loss for a quicker exit.
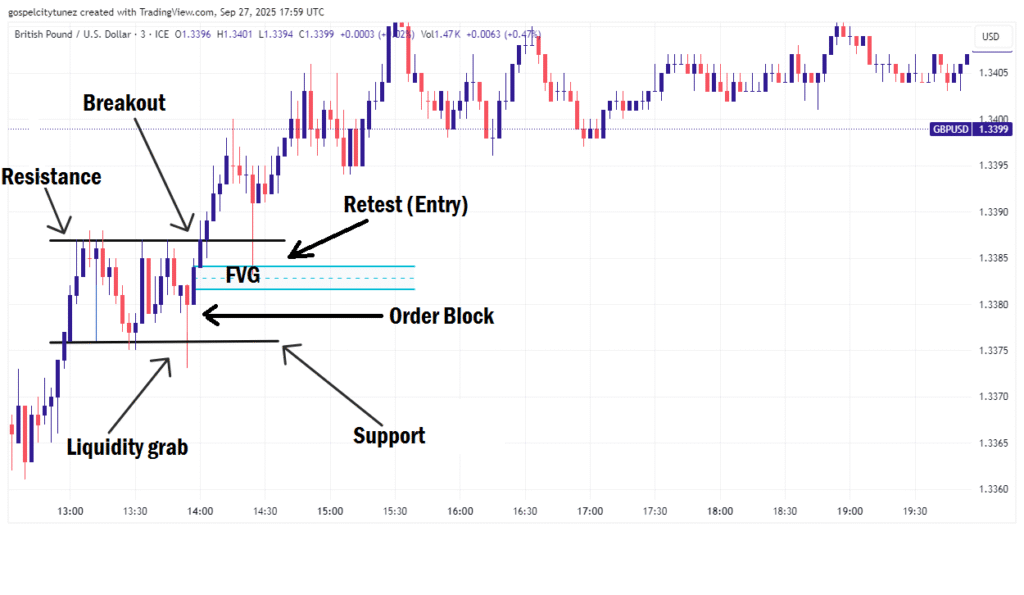
Result: You’ve avoided the false breakout and entered at the exact spot where institutions are buying.
Why This Combo Works
The Rectangle gives you structure (support and resistance), while SMC gives you precision (exact entry zones).
This combination means you’re no longer guessing your entries or getting stopped out by market manipulation. Instead, you’re trading with the institutions, not against them.
Final Thoughts
The Rectangle chart pattern is simple, powerful, and easy for beginners to master. On its own, it works well, but when you combine it with the Smart Money Concept (SMC), using tools like Fair Value Gaps, Order Blocks, and ICT Breakaway Gaps, it becomes a complete trading strategy.
If you’re a beginner, this approach will save you from false breakouts, give you cleaner entries, and help you grow your account steadily over time. But you need to have it in mind that no strategy works 100% at a time in forex trading. That is why you need to practice and master your trading skills with a demo account before going to the live market with real money. Also, apply proper risk management by risking only 1% of your trading capital per trade.
The next time you see price moving sideways in a box, don’t rush. Wait for the breakout, confirm with SMC, and trade like the institutions. If you have more questions on this topic, do let us know in the comments section. Trade like the smart money!


