")
Understanding Price Action or Market Structure in Forex Trading
One of the biggest reasons most retail traders lose money in the forex market is their lack of complete understanding of price action, also known as market structure. Mastering price action in forex trading is not optional. It is essential. It forms the foundational basis of your trading profitability. When you truly understand price action, you gain the power to interpret what the market is doing at any given moment and make smart, informed trading decisions accordingly.
Before we proceed, kindly open your chart. You can choose GBP/USD, GBP/JPY, EUR/USD, or any other currency pair you are comfortable with. We’re going to engage you practically in this lesson for a better learning experience.
As a beginner forex trader, if you do not understand price action, you are already at a great disadvantage. Regardless of the trading strategy you’re using, whether it’s indicators, price patterns, or fundamentals, you still need a strong grasp of price action to trade effectively. So please, pay close attention, read carefully, and practice along.
What Is Price Action in Forex?
Price action refers to the movement or behavior of price on the chart over a given period. It is the natural structure that price forms as it fluctuates up and down in the market. Most traders also refer to this as market structure.
Since the introduction of online forex trading and charting platforms, price movement has followed a consistent pattern. This consistency is what allows traders to study and predict future moves. Price action remains one of the most powerful tools a trader can use to interpret market direction.
Understanding Price Charts in Forex
Every candlestick on your chart represents price movement over a specific time period. If you’re looking at a 1-minute chart, each candle represents price action within one minute. There are 60 minutes in an hour, which means 60 one-minute candlesticks make up a single 1-hour candlestick. Similarly, there are 24 hours in a day, so 24 one-hour candlesticks form a daily candlestick.
Also, there are 1,440 minutes in a day, which means it takes 1,440 one-minute candlesticks to form one daily candle. This logic applies to all timeframes. Price charts are fractal, patterns repeat across all timeframes, from the 1-minute to the monthly chart.
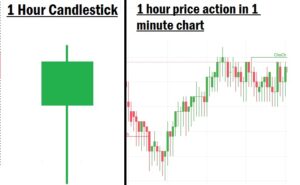
Understanding this fractal nature is important because it helps traders analyze the market regardless of the timeframe they choose to trade on.
How Does Price Move in Forex?
Price never moves in a straight line. It moves in a zigzag pattern, fluctuating up and down constantly. This fluctuation creates two main structural points on the chart:
- Highs (H)
- Lows (L)
A beginner trader once asked, “How do I trade this thing that moves like a zigzag?” The truth is, the zigzag movement of price is what makes trading possible. If the market only moved in a straight line, there would be no entry or exit opportunities, and traders wouldn’t be able to make profits.
Your job as a trader is to identify the turning points, those areas where the price is likely to reverse, and align your trades accordingly.
For instance:
- When the price falls and you anticipate a bounce or reversal, you can place a buy trade. If the price then rises, you profit from that upward move.
The Three Phases of Price Movement
Price movement always occurs in one of three phases:
- Uptrend
- Downtrend
- Consolidation
At any given time, the market must be in one of these three phases. It cannot be in two phases at once. For example, it can’t be in both an uptrend and a downtrend simultaneously. One phase must end before another begins.
Let’s look at each phase in detail:
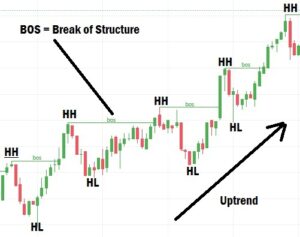
What Is an Uptrend in Forex?
An uptrend is when the market is moving upward, forming:
- Higher Highs (HH)
- Higher Lows (HL)
- A Higher High (HH) is a new high that is higher than the previous high.
- A Higher Low (HL) is a new low that is higher than the previous low.
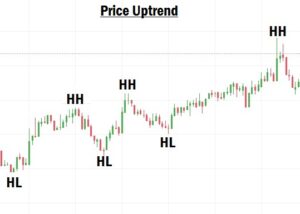
In an uptrend, the market continues to create HHs and HLs, showing that buyers are in control. For the market to be in a confirmed uptrend, it must consistently form HHs and HLs.
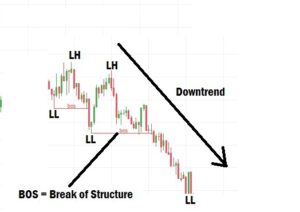
What Is a Downtrend in Forex?
A downtrend is when the market is moving downward, forming:
- Lower Highs (LH)
- Lower Lows (LL)
- A Lower High (LH) is a new high that is lower than the previous high.
- A Lower Low (LL) is a new low that is lower than the previous low.
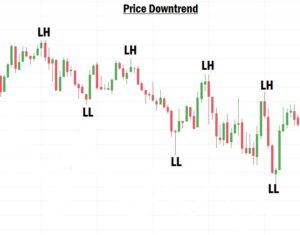
In a downtrend, the market consistently forms LHs and LLs, indicating that sellers are in control.
What Is Consolidation in Forex?
Consolidation is a market phase where price moves within a range, failing to create valid higher highs or lower lows.
During consolidation:
- The market lacks clear direction.
- Buyers and sellers are equally matched.
- Price moves sideways, bouncing between support and resistance.
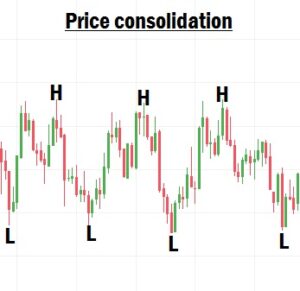
This phase usually occurs before a breakout or trend reversal.
Understanding Break of Structure (BOS) in Forex
A Break of Structure (BOS) occurs when price breaks a recent Higher High (HH) or Lower Low (LL) with a full candlestick body closing above (or below) the previous structural point.
It is not a valid BOS if:
- Only the wick of the candlestick breaks the previous high or low.
- There is no candle body closing beyond the structure.
Example (Uptrend):
- The market forms a Higher Low (HL) due to a pullback or retracement. After the retracement, the price moves up and breaks the previous Higher High (HH).
- If a candlestick closes above the previous HH with its body, that’s a valid BOS.
Example (Downtrend):
- A Lower High (LH) is formed due to a retracement. Then, the price drops and breaks the previous Lower Low (LL).
- If a candlestick closes below the LL with its body, that confirms a valid BOS.
Understanding Market Structure Shift (MSS) or Change of Character (CHoCH)
A Market Structure Shift (MSS) or Change of Character (CHoCH) occurs when the trend is about to reverse:
- From downtrend to uptrend
- Or from uptrend to downtrend
How it happens:
- In a downtrend, if the price breaks a Lower High (LH) and forms a Higher High (HH), the structure has shifted.
- It signals that the market is no longer making Lower Lows, and a new uptrend could begin.
This same concept applies in the opposite direction:
- In an uptrend, if the price breaks a Higher Low (HL) and forms a Lower Low (LL), the structure has changed in favor of sellers.
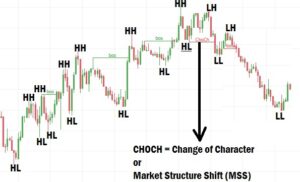
This point of change is extremely important. It is where the character of the market shifts, giving you the opportunity to reposition.
Understanding a Valid Retracement in Forex
A valid retracement or pullback is a temporary reversal in price before the main trend continues. When price comes back into a range before creating a new higher high or lower low, it is called a retracement or pullback. For a retracement to be valid, it must consist of:
- At least 3 to 4 candlesticks of the same color closing above each other.
- Or two long candlesticks of the same color, showing momentum.
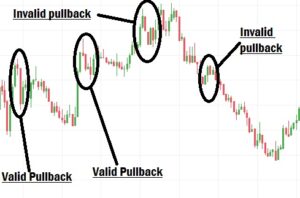
Note: Two short candlesticks are not enough to consider it a valid retracement.
Example (Uptrend):
If price is forming Higher Highs, the retracement forming the Higher Low (HL) must consist of 3–4 bearish candles closing above each other. If not, the HL is considered weak or invalid.
Without a proper retracement, any structural point formed may not hold and could result in a false signal.
Watch The Video Below For More Practical Examples
Final Thoughts
Understanding price action is not just important. It is the heartbeat of forex trading. No matter what strategy you use, without a solid grasp of price action, you may be gambling with your trades.
Price action allows you to read the market like a book. It tells you the story behind every candle, every swing high, and every swing low. It empowers you to enter and exit trades with confidence.
We strongly encourage you to open your charts and start practicing immediately. Study the movements. Identify the highs, lows, breaks of structure, and market structure shifts. That’s how you gain the edge.
In our next lesson, we will go deeper into “Understanding Technical Analysis.” Make sure you don’t miss it!


