
Understanding How to Use the Fibonacci Retracement Discount and Premium Zones in Forex According To the ICT (Inner Circle Trader)
Whether you’re a beginner or a seasoned trader, mastering the Fibonacci retracement tool can significantly improve your entry timing and boost your confidence in the market. One of the major challenges most traders face, especially newbies, is knowing where and when to enter the market. Early or late entries often result in getting stopped out or missing profitable moves. This is where the Fibonacci tool comes in to help you identify optimal trade entry zones based on how the market moves.
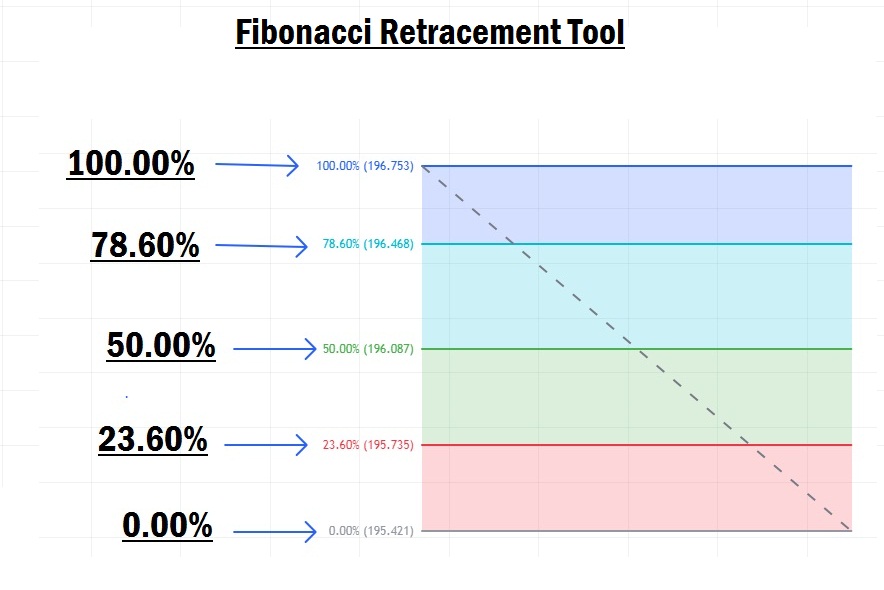
What Is the Fibonacci Retracement Tool in Forex?
The Fibonacci retracement tool is a popular technical analysis instrument used to forecast potential support and resistance levels in the forex market. It’s based on the Fibonacci sequence, a series of numbers that reflect natural ratios found in various aspects of life, including market behavior.
This tool works by plotting horizontal levels based on specific Fibonacci percentages, such as 23.6%, 38.2%, 50%, 61.8%, 78.6%, and 100%, to identify where price is likely to retrace before continuing in the original trend direction.
In simple terms, Fibonacci helps traders measure the range of a price movement and anticipate where a pullback might occur before the market continues upward (higher high – HH) or downward (lower low – LL). It refines your entry strategy by pinpointing price retracement zones with the highest probability of a reversal.
A Practical Example
Imagine that the market is in a strong uptrend, consistently forming higher highs (HH) and higher lows (HL). Once a new higher high forms, you know to wait for a pullback before entering a buy trade. But the burning question is: “At what level of the pullback should I enter to avoid getting stopped out?”
That’s where the Fibonacci retracement tool becomes your best friend. It shows you exactly where in the retracement range to consider entering the market strategically, not emotionally. However, keep in mind: no tool in forex trading is 100% perfect. It’s all about probabilities and positioning.
⚙️ How to Properly Set Up the Fibonacci Tool
By default, the Fibonacci retracement tool comes with multiple levels that can be overwhelming for new traders. To make it cleaner and more effective:
- Open the Fibonacci settings in your charting platform.
- Navigate to the “Style” tab and locate the “Levels” section.
- Change the “Values” option to “Percents.”
- Uncheck all the levels except the following:
- 0.00% (0.00)
- 23.60% (0.236)
- 50.00% (0.5)
- 78.60% (0.786)
- 100% (1.0)
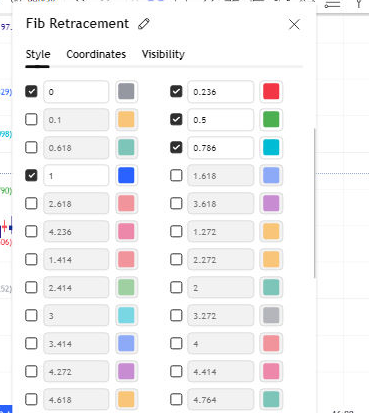
Some traders prefer using only 0%, 50%, and 100%, but we recommend leaving the four main levels (0.236, 0.5, 0.786, and 1.0) for a more complete analysis.
Feel free to customize the colors to suit your chart’s theme. Remember, this setup is not a one-size-fits-all. Traders have their preferences, but this setup has proven effective over time.
Important: The Fibonacci retracement tool is not a strategy by itself. It’s a precision tool used to enhance your entry accuracy. We are teaching you how to use it for entry refinement, not as a standalone strategy or confirmation method.
Understanding Discount and Premium Zones with Fibonacci
The Fibonacci tool divides price retracement into two major zones:
- Premium Zone: From 50% up to 100%
- Discount Zone: From 50% down to 0%
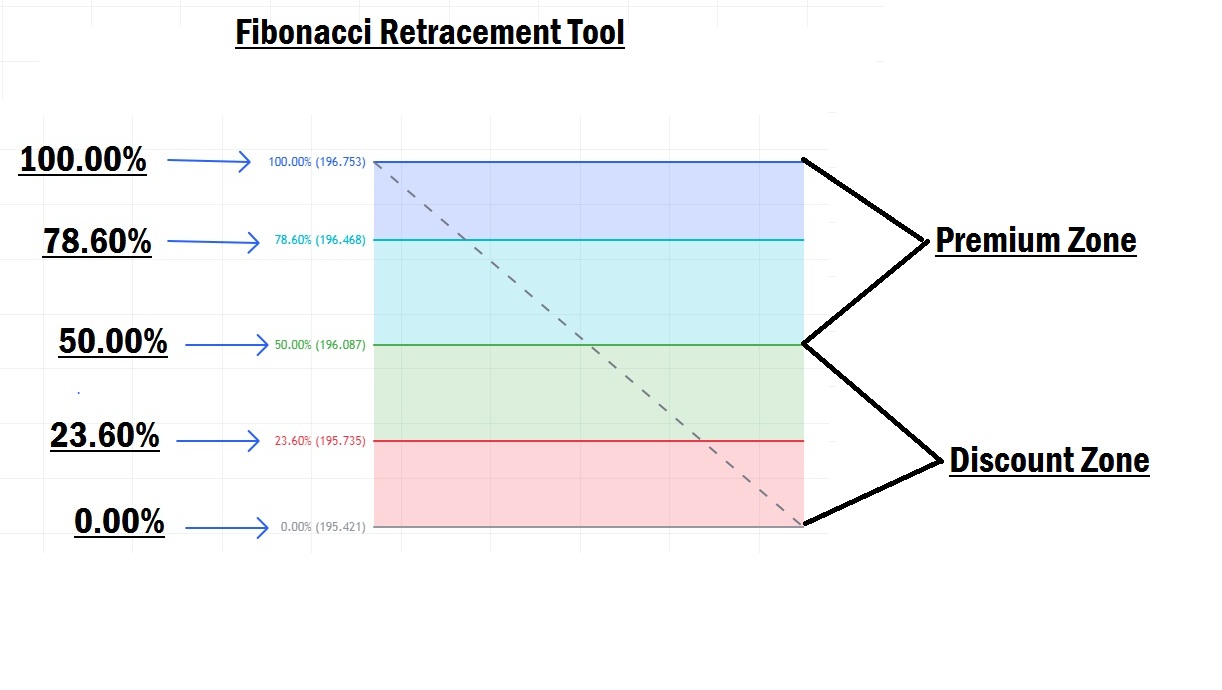
Here’s how they work:
- In a downtrend, the premium zone is the best area to look for sell opportunities.
- In an uptrend, the discount zone is the ideal area to look for buy opportunities.
Now, let’s talk about the sweet spots:
- Optimal Trade Entry (OTE) for Buys: From 23.60% down to 0.00%
- OTE for Sells: From 78.60% up to 100%
Buy Trade Example
If the market is trending upward and forms a new higher high, wait for a retracement back into the range.
- Plot the Fibonacci tool from the swing high to the swing low.
- As the price pulls back and crosses below the 50% retracement level, it enters the discount zone, signaling potential buy entries.
- For more precision, wait for price to reach the OTE zone (23.60% – 0.00%) for an optimal entry with a smaller stop-loss.
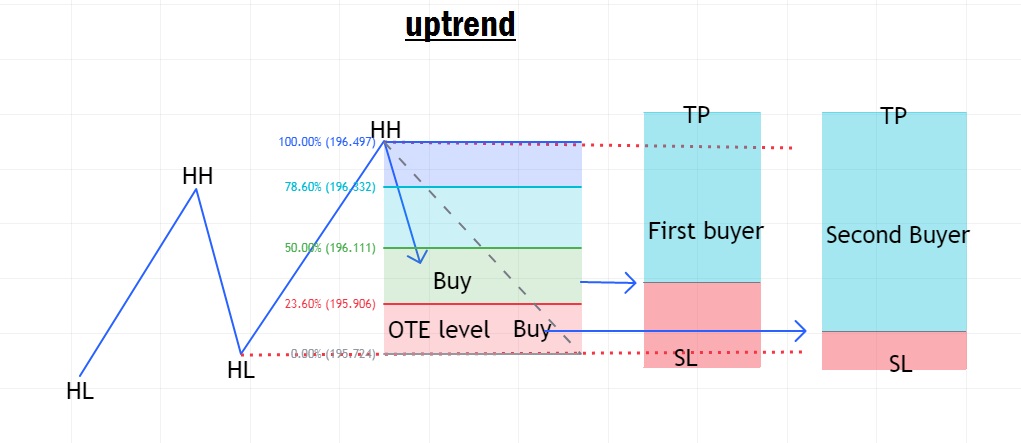
Note: Price won’t always reach the OTE level, so it’s your call whether to wait for that perfect entry or take advantage of earlier discount zone opportunities.
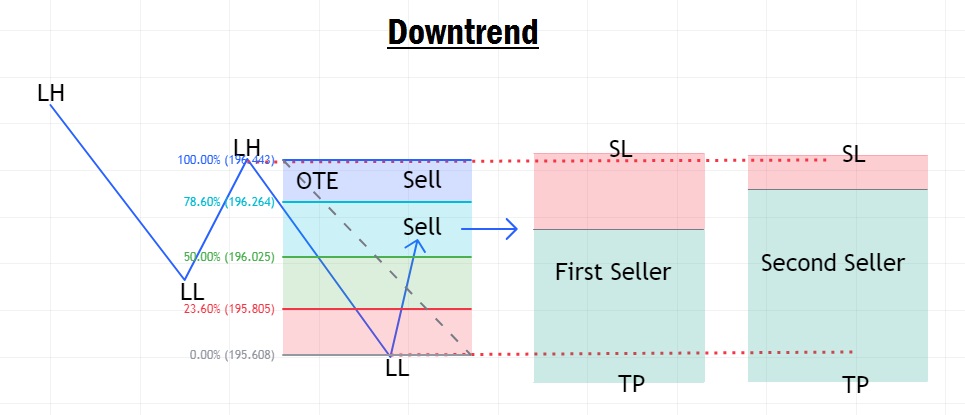
Sell Trade Example
If the market is in a clear downtrend, forming lower lows (LL) and lower highs (LH):
- Wait for a retracement after a new lower low.
- Plot your Fibonacci tool from the recent lower high to the lower low.
- When the price retraces beyond the 50% level, it enters the premium zone, a great place to look for sell opportunities.
- For a higher probability entry, target the OTE sell zone (78.60% – 100%), which also offers tighter stop-loss placement.
Final Thoughts
Some traders make the mistake of using the Fibonacci retracement tool as a complete trading strategy, and that’s a risky move. This tool is not a strategy, but rather a supporting instrument for identifying key price levels where you can enter trades more effectively.
Relying on Fibonacci alone without proper market context, structure, or confirmation can lead to unnecessary losses. Use it as part of your toolkit, not the entire toolbox.
In our next lesson, we will dive into “Top Down Analysis in Forex.”
See you there, my champion!


")