
In today’s session, we will be discussing “Trading the Double Top Chart Pattern in Forex Like a Pro.”
The double top chart pattern is another simple yet powerful trading strategy that has stood the test of time in the financial market. It’s very easy to spot on a price chart and becomes highly effective when you master how to trade it correctly. Although this technique is beginner-friendly, it still requires a deep understanding to trade it profitably. The opposite version of this pattern is known as the double bottom, and both patterns serve the same purpose: identifying trend reversals.
Many professional forex traders rely on the double top pattern to catch high-probability and profitable trading opportunities in the foreign exchange market. However, remember: nothing is ever truly “simple” in Forex. Trading successfully requires you to be strategic with every move you make in the market.
We always remind beginners that no strategy in forex trading is perfect or works 100% of the time. Trading is a game of probabilities, and that naturally comes with risks. Before risking your real money, it’s essential to practice and master your strategy in a demo account. If you can’t achieve consistent profitability in the demo environment, chances are slim in the live market. The more you practice, the more confident and skilled you become in executing any strategy you choose to trade with.
The double top pattern offers great potential for sniper entries because it is designed to catch trend reversals. So, in this lesson, we’ll show you exactly how to trade the double top pattern like a pro.
What Is a Double Top Chart Pattern in Forex?
A Double Top pattern in Forex is a bearish reversal formation that typically appears after an extended uptrend. It signals a potential shift in market sentiment from bullish to bearish. The pattern forms when price makes two unsuccessful attempts to break through a resistance level and fails to continue higher. Visually, it resembles the letter “M,” consisting of two peaks (tops) at roughly the same price level, separated by a trough, also known as the neckline.
This pattern occurs when the price creates a swing high, pulls back to form a swing low (the neckline), and then attempts to push higher again but fails to create a new high. It indicates buyer exhaustion and increasing weakness among the bulls.
What Is a Double Bottom Chart Pattern in Forex?
A Double Bottom is simply the inverse of the Double Top pattern. It is a bullish reversal pattern that reflects the weakening of sellers in the market. While the double top forms an “M” shape, the double bottom forms a “W” shape, yet both are trend reversal formations.
The double bottom occurs when the price forms a swing low, retraces to create a swing high (neckline), then tries to break lower again but fails to form a new low. This failure indicates seller exhaustion and signals potential bullish momentum.
How to Identify a High-Probability Double Top
Not every double top or bottom pattern you see on a chart is reliable. Some are mere fakeouts designed to trap traders and induce liquidity. High-quality double top or bottom patterns are usually found at key zones or strong order blocks, especially those on higher timeframes, which tend to hold more weight and significance.
One strong signal of a high-probability pattern is when the second swing in the double top (or bottom) sweeps the liquidity built by the first swing before breaking the neckline. If this liquidity sweep is followed by a strong neckline break, it suggests a valid reversal setup, particularly when it occurs at a key zone or order block.
How to Trade the Double Top or Bottom Chart Pattern Effectively
High-probability double tops and bottoms occur at major key levels or strong order blocks. When price reaches a significant resistance or support level, it often tests the zone multiple times before a reversal occurs.
Double Top Setup:
- Price moves into a strong resistance zone or bearish order block.
- It pulls back to form a swing low, which becomes the neckline.
- Price attempts to break the resistance zone again but fails.
- A strong bearish move follows, breaking the neckline with momentum.
- Entry: Look to enter a sell trade when price comes back to retest the neckline.
- This confirms that sellers are taking control.
Double Bottom Setup:
- Price drops into a strong support zone or bullish order block.
- It pulls back to form a swing high, which serves as the neckline.
- Price tests the support zone again but fails to break lower.
- A bullish reversal occurs, breaking the neckline with strong momentum.
- Entry: Wait for a retest of the neckline, then enter a buy trade.
Example:
Let’s say the market is in an uptrend and approaching a well-marked resistance zone. After some time, price finally touches the zone and pulls back, forming a swing low; this becomes your neckline.
What you should do:
- Use your line tool to mark the neckline.
- Wait for price to return to the resistance zone again.
- If the second touch sweeps liquidity from the first swing high and then breaks the neckline, this is a strong reversal signal, commonly referred to as a breaker block reversal pattern, a concept taught by the Inner Circle Trader (ICT).
This is an A+ setup:
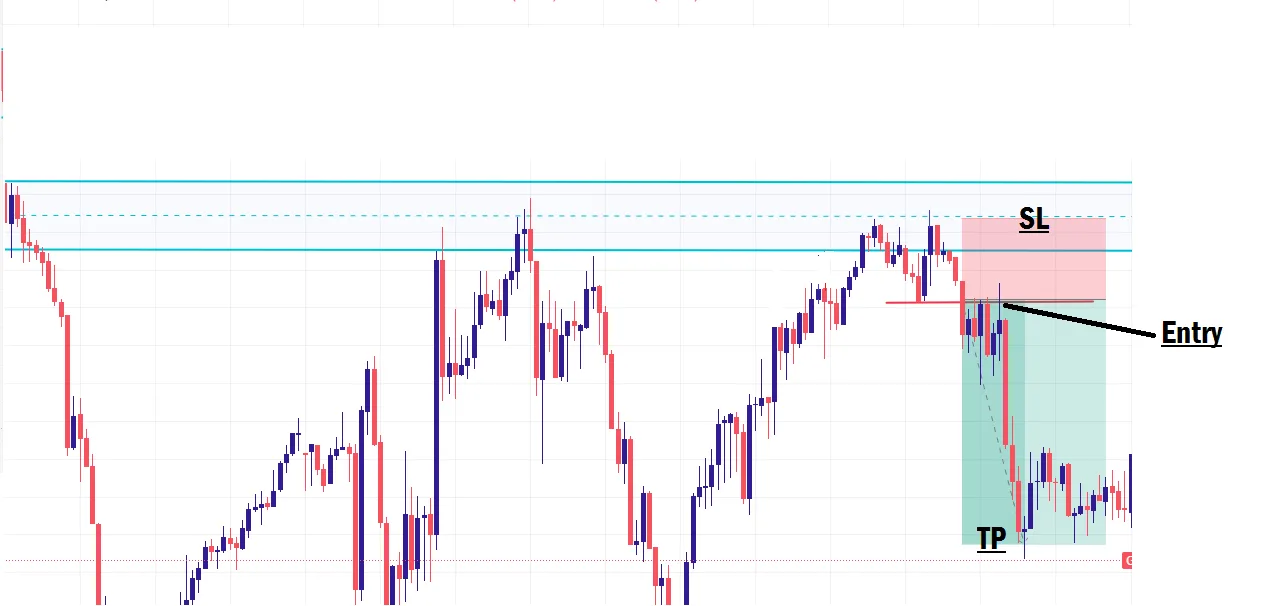
- Enter your sell trade after the neckline is retested.
- Place your stop loss above the second top.
- Set your take profit target at least 2x or 3x your stop loss, or more, depending on market conditions.
The same logic applies in a downtrend scenario when identifying and trading a double bottom pattern. After the neckline break and retest, you can confidently enter a buy trade.
Final Thoughts
The double top chart pattern is not a “holy grail” strategy. Nothing in forex trading is guaranteed; it all comes down to probabilities and strategic execution. Always use proper risk management and avoid emotional decision-making.
Every trade you enter should have a clearly defined reason; if it doesn’t answer the “why” behind your position, it’s likely to fail. So, take the time to learn, practice, and refine your skills using a demo account before putting your real money on the line.
In our next class, we’ll be exploring “Flag Pattern Trading Strategy.” Don’t miss it!


