How Beginners Can Combine the Head and Shoulders Chart Pattern with Smart Money Concepts (SMC) for Better Trading Results
The Head and Shoulders chart pattern stands out as a crucial component for beginners in trading. It is a technical signal that indicates a potential trend reversal based on the underlying psychology of market participants. Simply put, it acts as a warning that the current trend may be losing momentum and that a shift could be imminent. By pairing this with Smart Money Concepts (SMC) such as the Fair Value Gap (FVG), Order Block (OB), and ICT Breakaway Gap, traders can greatly enhance the accuracy and profitability of their strategies.
In this article, you’ll learn everything you need to know about the Head and Shoulders chart pattern, including its structure, types, and how to trade the break and retest of the neckline using institutional trading tools for high-probability entries.
Among all the simple and classic chart patterns, the Head and Shoulders pattern stands out as one of the most beginner-friendly and reliable setups. It has consistently helped traders identify high-quality trend reversal opportunities across various markets. However, one of the biggest challenges faced by both beginners and even some experienced traders is identifying valid Head and Shoulders setups and entering trades precisely to minimize losses and maximize profits.
When your entry is precise, you know exactly where to place your Stop Loss (SL) and Take Profit (TP) levels, avoiding premature stop-outs and securing smooth exits. That’s exactly why combining this pattern with the Smart Money Concept (SMC) gives you a significant edge.
Head and Shoulders Chart Pattern Performance
The Head and Shoulders chart pattern is both simple and powerful, making it easy for beginners to identify and trade effectively. This pattern has been employed for decades by professional traders and remains one of the most dependable reversal patterns in forex trading.
According to backtest results and industry statistics, the Head and Shoulders pattern has an average win rate of over 75% when traded correctly. This statistic is supported by an analysis of 1,200 Head and Shoulders cases on EUR/USD, GBPUSG, GBPJPY, and USDJPY spanning the period from 2015 to 2022. This impressive success rate becomes even more consistent when combined with Smart Money Concepts, giving traders additional confluence and precision.
Why You Should Combine the Head and Shoulders Pattern with Smart Money Concepts (SMC)
The primary reason for combining these two approaches is precision, profitability, and validation.
Trading every Head and Shoulders pattern that appears on your chart without confirmation is a quick way to lose money. Not every pattern is valid or tradable. By applying SMC tools, you can easily filter out weak or manipulated setups that often result in unnecessary losses.
A valid Head and Shoulders pattern is usually formed around key institutional levels, such as:
- A strong support or resistance zone, or
- A high-timeframe Order Block (OB).
When these conditions align, it becomes a high-probability setup that reflects institutional activity, giving you confidence to take the trade.
Introduction to Smart Money Concepts (SMC)
The Smart Money Concept (SMC) is a trading methodology built around the idea of following the footprints of institutional traders, the so-called “smart money.” These are large financial institutions, banks, and hedge funds that dominate price movements in the forex market.
Because they trade in massive volumes, institutions need liquidity to fill their orders. To achieve this, they often drive price toward areas where retail traders have placed stop losses or pending orders, triggering those positions to provide liquidity for their entries.
By understanding how these manipulations occur, you can align yourself with institutional order flow instead of being trapped by it.
Key Smart Money Concept Entry Models
Some of the most powerful SMC entry models include:
- Fair Value Gaps (FVGs):
These are price imbalances created when the market moves rapidly in one direction, leaving an unfilled gap on the chart. FVGs often act as magnets where price returns before continuing in the original direction. - Order Blocks (OBs):
The last bullish or bearish candle before a strong impulsive move. These zones often represent institutional entries and can be used to refine your own trade entries. - ICT Breakaway Gaps:
Large gaps that form when price breaks out decisively from consolidation zones, signal strong institutional activity.
By combining these SMC tools with the Head and Shoulders chart pattern, traders can refine their entries, especially during the retest phase after a breakout, for more accurate and profitable trades. If you’re new to SMC or still struggling to understand how institutional trading works, consider starting our free structured masterclass on Smart Money Concepts to master these tools and start trading like the pros.
What Is a Head and Shoulders Chart Pattern?
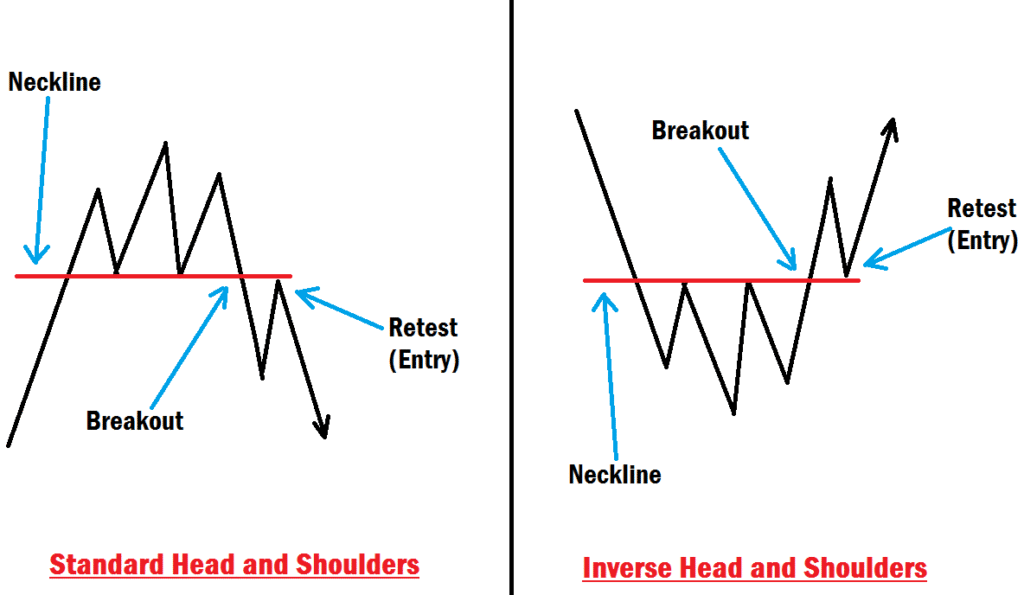
The Head and Shoulders pattern is a trend reversal chart pattern that signals a potential shift in market direction. It usually forms after a strong uptrend, showing that the bullish momentum is weakening and sellers are beginning to take control.
This pattern is made up of three distinct peaks:
- Left Shoulder: The first peak forms after a bullish rally and then retraces slightly.
- Head: The highest point in the pattern. It forms after another rally that surpasses the left shoulder before dropping again.
- Right Shoulder: A smaller peak that fails to break above the head, confirming that the bullish pressure is losing strength.
The line connecting the two swing lows between the shoulders is known as the neckline. Once price breaks below this neckline, it confirms the pattern and signals a potential bearish reversal.
Types of Head and Shoulders Patterns
There are two main types of Head and Shoulders patterns that every trader should know:
1. Standard Head and Shoulders (Bearish Reversal Pattern)
This pattern forms at the top of an uptrend and signals a bearish reversal. When price breaks below the neckline, it indicates that sellers are now in control, and a potential downtrend is about to begin.
2. Inverse Head and Shoulders (Bullish Reversal Pattern)
This is the opposite of the standard version. It forms at the bottom of a downtrend and signals a bullish reversal. Once the neckline is broken to the upside, it confirms that buyers are stepping in to push price higher.
Understanding both types allows you to take advantage of reversal opportunities in either market direction.
Why the Break and Retest of the Neckline Matters
Many traders make the mistake of entering trades immediately after the neckline breaks, only to get caught in a false breakout. A valid breakout comes with momentum, leaving an imbalance (FVG) in price delivery. The real power of the Head and Shoulders pattern comes during the retest phase, when price pulls back to retest the broken neckline before continuing in the direction of the breakout.
This retest offers a high-probability entry point because it aligns with institutional behavior. Smart money often pushes price back to the neckline areas to fill the imbalance (FVG) caused during the breakout before the real move begins.
That’s why combining the pattern with Smart Money Concept (SMC) tools like FVGs, Order Blocks, and ICT Breakaway Gaps can refine your entries and significantly boost your win rate.
How to Trade the Break and Retest Using Smart Money Entry Models
Let’s break down how beginners can use Smart Money entry models to catch the real move after the neckline retest. Remember to risk no more than 1% of your account per strategy idea. This helps in maintaining capital preservation and reinforces professional discipline.
1. Fair Value Gap (FVG) Entry
After the neckline is broken, look for a Fair Value Gap (FVG) that forms during the breakout move. This imbalance represents an area where price moved too quickly, leaving behind unfilled orders.
During the retest, price will often return to fill this gap before continuing in the direction of the trend.
During the retest, price will often return to fill this gap before continuing in the direction of the trend.
- Bearish Setup: Wait for price to break below the neckline and retrace into a bearish FVG for a sell entry.
- Bullish Setup (Inverse H&S): Wait for a neckline breakout and retrace into a bullish FVG for a buy entry.
2. Order Block (OB) Entry
Order Blocks are institutional footprints, the last bullish or bearish candle before a strong impulsive move.
After the neckline breaks, price often retests the Order Block that caused the FVG that led to the breakout. This gives traders a precise entry point with a small stop loss and a high risk-to-reward ratio.
After the neckline breaks, price often retests the Order Block that caused the FVG that led to the breakout. This gives traders a precise entry point with a small stop loss and a high risk-to-reward ratio.
- Bearish H&S: Look for a bearish Order Block near the neckline retest.
- Bullish H&S: Look for a bullish Order Block near the neckline retest.
The best area to make your entry is the FVG. Because most times, price do not get to the order block before leaving. This will prevent you from missing trades.
3. ICT Breakaway Gap Entry
When the breakout is strong, it sometimes leaves behind a Breakaway Gap, a clear price gap showing institutional aggression. This gap often acts as a strong support or resistance level during the retest.
Once price revisits the gap area, it leaves without getting to the order block due to momentum. This provides another precise entry opportunity.
Once price revisits the gap area, it leaves without getting to the order block due to momentum. This provides another precise entry opportunity.
Step-by-Step Trading Plan for Beginners
Here’s a simple framework you can follow to trade the Head and Shoulders pattern using Smart Money Concepts:
- Identify the Pattern: Spot the Left Shoulder, Head, and Right Shoulder structure clearly.
- Mark the Neckline: Draw a clean trendline connecting the two swing lows (for a bearish H&S) or swing highs (for a bullish inverse H&S).
- Wait for the Breakout: Do not rush in. Wait for a confirmed breakout with momentum and a candle close significantly beyond the neckline.
- Use SMC Tools for Confirmation: Mark any Order Block, FVG, or ICT Breakaway Gap near the neckline.
- Wait for the Retest: Allow price to return to these areas.
- Enter with Confirmation: Once price taps into an SMC area and shows rejection, enter your trade.
- Set Stop Loss and Take Profit: Place SL above the right shoulder or order block (for bearish setups) or below it (for bullish setups). Set TP at the next liquidity level or major swing point. You can also target two to three times the size of your stop loss for easy exit.

Final Thoughts
The Head and Shoulders chart pattern is more than just a visual formation; it’s a reflection of market psychology and liquidity shifts. When combined with Smart Money Concepts, it becomes a precision trading tool capable of giving you consistent and profitable results.
By patiently waiting for the break and retest of the neckline and aligning your entries with FVGs, Order Blocks, or ICT Breakaway Gaps, you’ll avoid false breakouts and start trading like the professionals who move the market.
Make sure you practice and master this trading approach in your demo account before going to the live market with your real money. Trade responsibly!

