
Falling Wedge Chart Pattern Explained with SMC Trading Entries
Every novice trader wakes up with a pressing concern: how to identify reliable trading patterns that can lead to consistent gains. In this session, we are going to dive into the Falling Wedge Chart Pattern and explore how you can combine it with SMC (Smart Money Concepts) entry models like Fair Value Gaps (FVGs), Order Blocks, and other institutional reference points for more precise and profitable trades.
The falling wedge chart pattern is one of the most powerful and effective trading strategies in forex. It is simple, straightforward, and has consistently helped professional traders gain an edge in the market. When you master the skill of spotting this pattern with ease, the rewards can be very significant.
In today’s modern trading world, some traders have been introduced to new strategies and often view the falling wedge as outdated or old-fashioned. But the truth is, no profitable trading strategy ever becomes obsolete. The falling wedge chart pattern still delivers strong results if you know how to identify it correctly and trade it effectively. In fact, studies show that after a valid falling wedge breakout, the average pip move can be as significant as 150 pips, underscoring its effectiveness when utilized properly.
Now, imagine combining this timeless pattern with modern trading approaches like the Smart Money Concept (SMC). The result can be massive. Picture opening your forex chart, spotting a valid falling wedge, and then aligning your entry with institutional footprints taught by the Inner Circle Trader (ICT). This combination enables you to view the market through the eyes of savvy investors, hedge funds, and institutional traders who frequently target retail stop-losses.
No Strategy Is a Holy Grail
One important thing beginner traders must understand is that no trading strategy is perfect. The market does not allow for 100% accuracy; it is always about probabilities, not guarantees. That’s why it’s crucial to avoid low-quality setups that can drain your account.
Instead, practice your strategy, backtest it, and master it on a demo account before moving to the live market with real capital. Proper preparation ensures you have the confidence and skill to handle market conditions effectively.
Why Combine the Falling Wedge Pattern with SMC?
The answer is simple: precision and profitability. Smart Money Concept (SMC) is the modern way traders approach the forex market in the 21st century. It shines light on the hidden footprints of market makers and exposes how institutional players move price. (Institutional footprints refer to the trading activities and patterns left by large financial institutions. Breakaway gaps are gaps on the price chart that indicate a strong move, often due to institutional trading.)
When you combine the falling wedge chart pattern with SMC, it’s like pouring fuel on an already burning fire. It gives you sharper entry confirmations, reduces unnecessary risks, and maximizes your profit potential. SMC allows you to align your trades with the true direction of institutional money, giving you a massive advantage over retail traders.
If you are new to SMC, consider starting with our free course to understand how it works. Once you combine it with classic chart patterns like the falling wedge, your trading results will be elevated to a whole new level.
What is the Falling Wedge Chart Pattern?
The Falling Wedge is a bullish reversal pattern that appears after a strong downtrend or during a correction in an uptrend. It looks like two converging downward-sloping trendlines, with price making lower highs and lower lows. But here’s the key: the slope of the lows is usually steeper than the highs, which signals that the bearish momentum is losing strength.
This pattern is like the market “running out of breath” on the downside. When the falling wedge completes, it often breaks to the upside, giving traders a high-probability bullish opportunity.
Bearish Falling Wedge Chart Pattern?
The opposite of the falling wedge chart pattern is in form of a rising wedge. It is a bearish reversal chart pattern that indicates a reversal of price from a bullish to a bearish trend. Bullish falling wedge and bearish falling wedge are the same pattern, but opposite to each other. The trade entry model applicable to a bullish falling wedge pattern is also applicable to a bearish falling wedge, but in the opposite direction. When you anticipate the reversal of an existing downtrend, a falling wedge is a strong signal. But when you anticipate the reversal of an existing uptrend or a correction in a downtrend, a bearish falling wedge is a strong indicator. Make no mistake about it.
How To Identify a Falling Wedge Chart Pattern
For you to correctly identify and trade this pattern, look out for these characteristics:
- Downward Slope: Both support and resistance lines slope down, but they converge toward each other.
- Volume Decline: Price movement gets tighter, showing that sellers are losing strength in the market.
- Breakout Direction: The breakout usually happens to the upside, signaling a potential trend reversal. But if it is a rising wedge, the breakout happens to the downside.
- Timeframe Flexibility: The falling wedge works across all timeframes, but higher timeframes (H1, H4, Daily) give more reliable signals.
Why Falling Wedge Matters to a Beginner Trader
As a beginner, you want to trade setups that give you clarity and confidence. The falling wedge is perfect because it is easy to spot and usually forms before a strong bullish move.
However, like any chart pattern, it is not enough to just enter blindly. This is where SMC concepts come in to refine your entry and give you a higher probability trade.
Combining Falling Wedge with Smart Money Concepts (SMC)
Now, let’s take it a step further and combine the falling wedge with institutional reference points like FVGs, Order Block, Breakaway Gaps, or Liquidity Zones. This is how the pros refine their trading.
- Fair Value Gaps (FVGs):
After the wedge breakout, look for an FVG on the lower timeframe (M5, M15). This acts as a premium entry point where institutions are likely to rebalance price before pushing it higher. - Order Block:
If the bullish falling wedge forms near a strong bullish order block (OB), that’s a strong confluence. It means the market is respecting institutional footprints, and the breakout could be much stronger. But in the case of a bearish falling wedge, a strong bearish order block should be considered. - Liquidity Sweeps:
Often, before price breaks out of a falling wedge, it sweeps liquidity below the last low. Once this liquidity grab happens and price returns inside the wedge, it’s a sign that institutions are preparing for the bullish move. For a more precise entry, look for an ICT breakaway gap or an FVG when price breaks out of the wedge and pulls back.
Step-by-Step Guide to Trading Falling Wedge with SMC
To reinforce learning and build confidence, commit to logging 20 demo-account wedge trades before risking any real capital. For each trade, note your entry rationale, the conditions you observed, and your emotional state. This deliberate practice with specific micro-goals can accelerate your skill formation, providing you with more insights into the patterns and helping you achieve greater consistency in your trading approach. Here’s a simple strategy you can follow:
- Spot the Pattern: Identify the bullish falling wedge on your chosen timeframe around a strong bullish order or support area.
- Wait for the Breakout: Don’t rush in. Allow the breakout candle to confirm bullish intent.
- Refine with SMC: Drop to a lower timeframe and look for a liquidity grab alongside an FVG or breakaway gap that aligns with the breakout.
- Set Entry & Stop Loss: Enter when price pulls back into the gap (FVG or ICT Breakaway gap), which is the refined SMC level. Place your stop loss (SL) below the wedge’s last low.
- Target Smartly: Your take profit (TP) can be the wedge’s height projected upward, and you can extend targets to the next liquidity pool or imbalance zone.
Example of Trade Setup
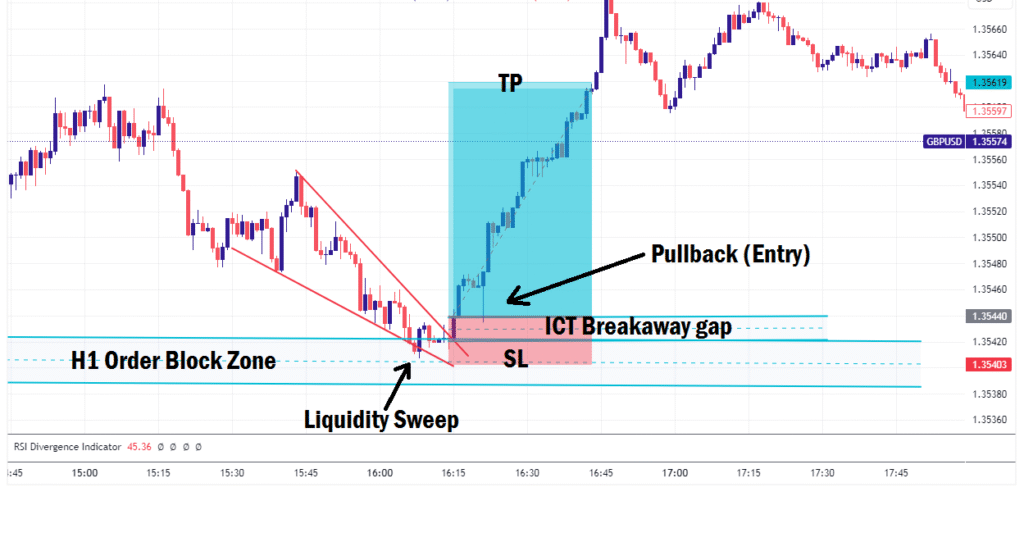
Imagine GBP/USD is in a downtrend on H1. You notice price forming a falling wedge, with clear lower highs and lower lows around a valid bullish order block. On breakout, you switch to M15 and see a clean bullish order block aligning with a fair value gap or an ICT breakaway gap after a liquidity grab. You enter at the FVG or breakaway gap, stop below the last low, and target the next liquidity pool above. For instance, you might set a 30-pip stop and aim for a 90-pip first target. This provides a clear risk-reward ratio to guide your decision-making.
This kind of trade setup gives you precision and confidence rather than guessing. This same method is also applicable to a bearish falling wedge, which is the direct opposite of a bullish falling wedge.
Final Thoughts
The Falling Wedge Pattern is a powerful bullish reversal signal, but trading it alone is not enough. By combining it with SMC tools like Fair Value Gaps, Order Blocks, breakaway gaps, and liquidity zones, you put yourself in alignment with how institutions trade the market.
For a beginner, this approach not only improves accuracy but also helps you build a trading mindset focused on discipline and precision.
When you see the market slowing down in a falling wedge, remember: the big players may be preparing for a bullish push. With patience and smart entries, you can catch the move alongside them.
If you have further questions concerning this approach, or have any topic you would like us to cover for you, use the comment section to let us know. Learn to trade with precision.


