
Mastering the Expanding Triangle Chart Pattern with Smart Money Concept (SMC) Entries in Forex Trading
Unlock institutional-grade entries by pairing Expanding Triangles with the Smart Money Concept (SMC). Many beginner and struggling forex traders are constantly searching for ways to improve their trading performance and increase profitability in today’s modern market. In this lesson, we’ll walk you through how to sharpen your trading skills by combining the Expanding Triangle Chart Pattern with the Smart Money Concept (SMC), two powerful strategies that can significantly transform your trading approach.
When it comes to forex trading, chart patterns remain one of the most powerful tools for analyzing price action. Among these patterns, the Expanding Triangle, also known as the Broadening Formation, stands out because of its unique shape and the way it signals potential volatility in the market.
The Expanding Triangle Chart Pattern has been a trusted tool in forex trading for years. With a proven track record supported by backtested results and industry data, this pattern has helped countless professional traders capture profitable and high-quality trades across the financial markets.
On the other hand, the Smart Money Concept (SMC) is a groundbreaking trading model that has gained increasing popularity among modern traders. It focuses on understanding institutional trading behavior to identify high-probability setups. By combining the expanding triangle with SMC, you not only boost your trading performance but also gain confidence as a trader.
A Word of Caution for Beginners
Professional longevity starts with the preservation of capital; every tactic follows that rule. It’s important to remember that no trading strategy works 100% of the time. Forex trading is based on probabilities, not guarantees. Market conditions vary, and there is no “perfect” strategy. That’s why consistent learning and practice are essential. Always master your strategy in a demo account before transitioning to live trading with real capital. If you’re not profitable in demo trading, you won’t suddenly become profitable in the live market.
Why Combine the Expanding Triangle Chart Pattern With SMC?
The answer is simple: precision and profitability.
When you make precise entries in the forex market, you can minimize risks and maximize profits. You’ll know exactly where to set your stop-loss (SL) and take-profit (TP) levels with greater accuracy.
The forex market has evolved into a more advanced space where traders are uncovering deeper insights every day. With the introduction of SMC by Inner Circle Trader (ICT), retail traders now have a way to interpret institutional activity. Institutions are the true market movers, and their actions often cause retail traders to lose money.
SMC equips you with tools to detect the footprints of these big players and align your trades in their direction rather than trading against them. Remember, institutional traders have the capital to push the market wherever they want. SMC helps you spot key institutional reference points such as:
- ICT Breakaway Gaps
- Fair Value Gaps (FVGs)
- Order Blocks (OBs)
- Liquidity Zones
Each of these gives traders a high-probability edge in execution.
Now, the expanding triangle pattern already works effectively as a standalone strategy based on both backtesting and live results. However, when combined with SMC, it’s like adding fuel to an already burning fire, creating a powerhouse strategy for consistent profitability.
If you’re still struggling to understand SMC, or if this is your first time hearing about it, we highly recommend starting with our free masterclass to build a strong foundation. With the right knowledge, practice, and the combination of chart patterns like the expanding triangle with SMC, you’ll be better equipped to trade confidently and profitably in the forex market.
What Is an Expanding Triangle Chart Pattern?
An Expanding Triangle is a chart pattern that forms when price action creates higher highs and lower lows, resulting in two diverging trendlines. Unlike symmetrical or contracting triangles, the expanding triangle widens as the market progresses, indicating an increase in volatility and indecision among buyers and sellers.
Key characteristics:
- Two Diverging Lines – The upper trendline slopes upward, and the lower trendline slopes downward, creating a widening formation.
- Higher Highs and Lower Lows – Each swing pushes beyond the previous one.
- Volatility Growth – Price ranges widen over time, showing stronger moves in both directions.
This pattern can appear in both bullish and bearish markets, and its breakout usually signals a strong trend continuation or reversal, depending on context.
Why the Expanding Triangle Matters for Traders
- It Shows Market Indecision – Traders and institutions are battling for control, which makes it a zone of opportunity.
- It Signals Pending Breakout – After price builds momentum inside the formation, a breakout often leads to strong moves.
- It Offers Institutional Footprints – Smart money tends to leave behind liquidity pools, order blocks, and gaps within these setups.
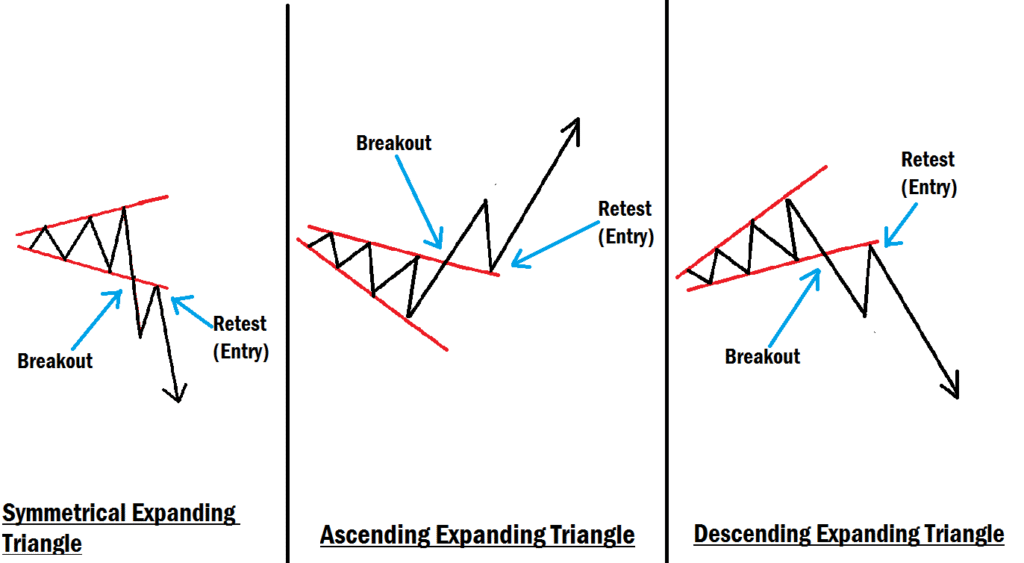
Types of Expanding Triangle Chart Pattern
- Ascending Expanding Triangle – Bullish in nature, where highs and lows keep expanding upward. It signals a strong bullish reversal of an existing downtrend. To trade it, you need to wait for a breakout to the upside. When the breakout occurs, wait for the retest and enter your buy position using SMC entry models. Your entry point is at the FVG or ICT breakaway gap caused by the breakout. Then, your stop-loss goes below the order block that caused price to break out and create a gap. Your take profit should be two to three times the size of your stop-loss or more.
- Descending Expanding Triangle – Bearish in nature, with widening lower highs and lower lows. It indicates a strong bearish reversal of an existing uptrend. To trade it, wait for the breakout to the downside. When the breakout happens, enter your sell position at the retest phase, utilizing the SMC entry models. The point of interest should be the FVG or ICT breakaway gap price created during the breakout. Your stop-loss should be above the order block that caused price to break out and create a gap. Target at least two to three times the size of your stop-loss or more as your take profit.
- Symmetrical Expanding Triangle – Neutral pattern that widens in both directions, waiting for a decisive breakout. It indicates indecision, which means that price may breakout from either the upside or the downside. In this case, wait for a clean breakout with momentum. When the breakout occurs, look for the FVG or ICT breakaway gap created by price during the breakout and use it as an entry point when price pulls back to retest the breakout area. Your stop-loss should be positioned below or above the order block that triggered the breakout, creating an FVG or breakaway gap. Then, your take profit should be two to three times the size of your stop-loss or more.
How to Trade the Expanding Triangle Pattern
Trading this pattern requires patience. Many beginners get trapped by false breakouts because they jump in too early. That is where combining it with Smart Money Concepts (SMC) becomes powerful; it helps you filter noise and find high-probability entries.
Here’s the step-by-step breakdown:
1. Identify the Pattern
Look for diverging trendlines and widening price swings. Confirm that price is making higher highs and lower lows.
2. Wait for the Breakout
The most important rule: Don’t trade inside the pattern unless you’re scalping. The real money is made when price breaks out of the expanding structure.
3. Use SMC Entry Models for Precision
Utilize the smart money concept to confirm the entry after a breakout. These smart money entry models include:
a. Fair Value Gaps (FVGs)
- When price breaks out of the triangle, look for imbalances (FVGs) left behind.
- Price often retraces into the FVG before continuing in the breakout direction. This happens during the retest phase after the breakout.
- That retracement gives you a low-risk, high-probability entry.
b. ICT Breakaway Gaps
- A breakout that leaves a clear gap signals institutional activity and momentum.
- Enter when price retraces to partially fill that gap before continuing in the breakout direction.
c. Order Blocks
- Look for the last bullish or bearish candle before the breakout move, depending on the direction of the breakout.
- This order block often acts as a powerful support or resistance zone.
- Use it to refine your entry after the breakout retest.
d. Liquidity Pools
- Expanding triangles trap both buyers and sellers, creating liquidity above highs and below lows.
- Once the breakout occurs, institutions often run liquidity before moving price in the true direction.
- Be patient and enter after liquidity has been swept. For instance, if price wants to break out to the upside, it will first sweep or grab liquidity from the downside.
4. Entry Strategy
- Breakout + Retest: Wait for price to break out and then pullback to retest the broken structure, often aligning with an FVG, or order block. To reinforce this strategy, verbalize the mantra: ‘Breakout, retest, confirm, execute.’ Repeating it aloud can help cement the habit and promote disciplined trading.
- Confirmation Entry: Only enter when you see the SMC confirmation (e.g., FVG fill + order block respect).
5. Stop-Loss & Take-Profit
- Stop-Loss: Place just below the order block or liquidity sweep for buy, and just above for sell. A well-placed stop not only adheres to technical analysis but also provides emotional relief, allowing traders to watch the market without fear. By defining your exit in advance, you gain the confidence to let the trade play out as intended, knowing your risk is managed.
- Take-Profit: Aim for the next major liquidity pool, or two to three times the size of your stop-loss.
Example of Trading the Expanding Triangle with SMC
- Price forms higher highs and lower lows → Expanding Triangle confirmed.
- Breakout happens to the downside.
- Price retraces into a bearish order block sitting inside a Fair Value Gap (FVG).
- Liquidity below recent lows gets swept before the breakout to the downside.
- You enter a sell position with a stop-loss above the order block and target the next liquidity pool. You can also target two to three times the size of your stop-loss for easy exit.
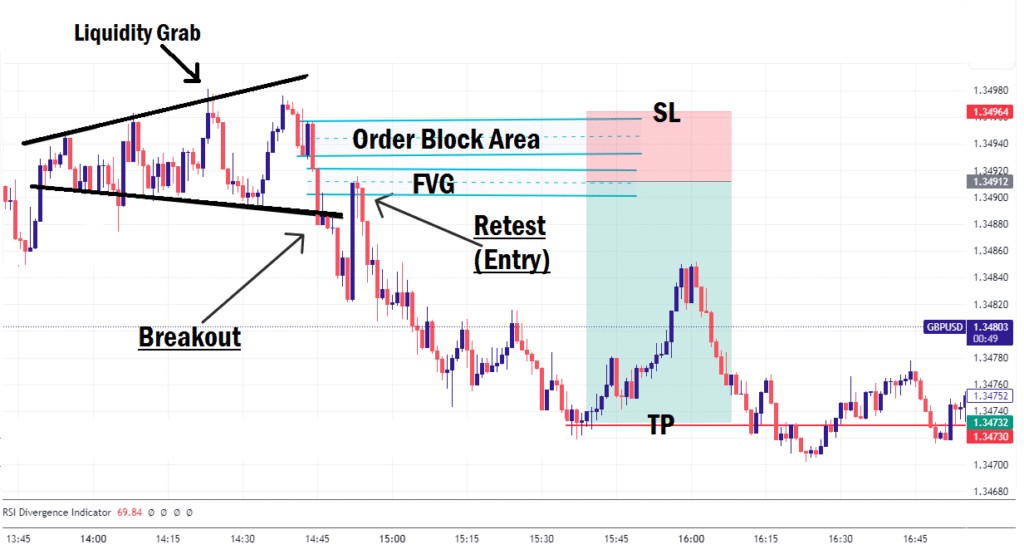
This structured approach keeps you aligned with smart money instead of chasing false breakouts.
Common Mistakes to Avoid
- Entering Too Early: Many traders rush into the breakout candle without waiting for a retest.
- Ignoring Liquidity: If you don’t check liquidity, you’ll often get stopped out before the real move.
- Forcing Trades: Not every widening formation is tradable. Use SMC Confluence for confirmation.
- Poor Risk Management: No pattern is 100%; always use stop-loss to protect your capital.
Final Thoughts
The Expanding Triangle chart pattern is a powerful setup, but it becomes even more effective when combined with Smart Money Concept entry models. By using FVGs, ICT Breakaway Gaps, Order Blocks, and Liquidity, you’re no longer guessing; you’re trading in alignment with institutional activity.
For beginners, the key is patience. Wait for the breakout, look for the retest with SMC confirmation, and only then take your entry. If you follow this process, the Expanding Triangle can become one of your most profitable trading patterns. If you have any topics you would want us to look into or have questions, let us know in the comments section.


