Understanding the Engulfing Candlestick Chart Pattern in Forex
In today’s session, we will be diving into “Understanding the Engulfing Candlestick Chart Pattern in Forex.”
The engulfing candlestick pattern is one of the simplest yet most powerful chart patterns every forex trader must know, regardless of the trading strategy they use. It is easy to spot on the chart, and when identified in the right zone, it can serve as a strong confirmation for profitable trade entries. Many professional traders rely on this pattern to capture high-probability moves in the financial markets.
However, the engulfing candlestick pattern can also be deceptive, especially when spotted at the wrong levels or market zones. That’s why you must apply caution and ensure all other trade-entry criteria are met before relying on this setup. Entering a position just because you see an engulfing candlestick, or because someone told you it’s a reversal pattern, is a common mistake. Always validate your entries with other confluences since engulfing candles can form anywhere on the chart without producing a valid reversal.
If you’re a beginner, you must also understand that forex trading is risky and based on probabilities, not guarantees. No strategy works 100% of the time, which is why practicing sound risk management is essential.
In this session, we’ll show you what a valid engulfing candlestick looks like and how to make high-probability entries with it in the forex market. If you’re ready, let’s dive in!
What Is an Engulfing Candlestick Chart Pattern in Forex?
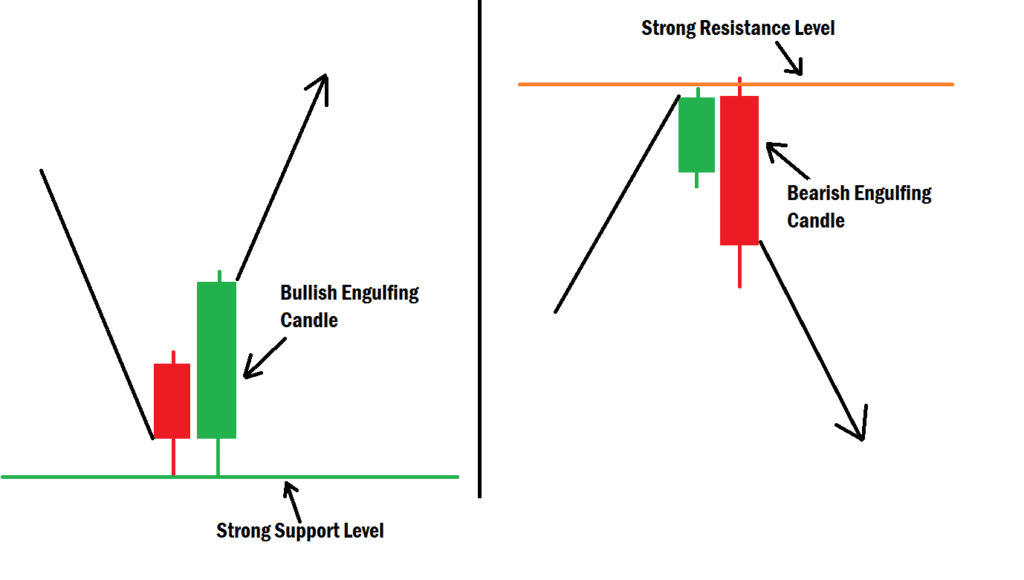
An engulfing candlestick is a two-candle price action pattern that signals a potential trend reversal. It consists of a smaller candle followed by a larger candle whose body completely “engulfs” the body of the previous one. The longer candle is referred to as the engulfing candle because it completely overshadows the smaller one.
This pattern forms when the second candle closes significantly above (bullish) or below (bearish) the first candle, showing that strong trading volume has entered the market to push price in the opposite direction.
There are two types of engulfing candlestick patterns:
- Bullish Engulfing
- Bearish Engulfing
Bullish Engulfing Candlesticks
A bullish engulfing pattern signals the reversal of a bearish trend and is often spotted at the bottom of a downtrend. It usually forms around strong support levels or bullish order blocks. The pattern indicates that buyers are entering the market with sufficient momentum to drive the price upward.
Bearish Engulfing Candlesticks
A bearish engulfing pattern is the opposite of a bullish engulfing. It indicates a potential reversal of a bullish trend and is commonly found at strong resistance levels or bearish order blocks. This pattern indicates that sellers are overpowering buyers and are preparing to drive price downward.
How to Spot a Valid Engulfing Candlestick
Not every engulfing candlestick signals a true reversal. In fact, they can appear anywhere on the chart without producing meaningful results.
What makes an engulfing candle valid is where it forms (key zones and strong order blocks). On its own, the pattern is not a complete trading strategy; instead, it should be used as confirmation alongside other technical tools. You should never enter a trade just because you saw an engulfing candle in a random spot.
Where to Use the Engulfing Candlestick for Trade Entry
- For Smart Money Concept (SMC) Traders:
An engulfing candle is often equivalent to a Market Structure Shift (MSS) on a lower timeframe. Instead of dropping down to confirm an MSS, you can wait for an engulfing candle to form on a higher timeframe. To use this effectively, ensure the pattern forms inside a strong order block or at a PD Array confluence, which gives you a higher probability of reversal. - For Non-SMC Traders:
Engulfing candles work best at key zones, such as support and resistance levels, or trendline touches. When price reaches these areas and forms an engulfing candlestick, it signals a strong likelihood of reversal.
How to Trade With Engulfing Candlesticks
Trading with engulfing candlesticks is simple and straightforward:
- Wait for the engulfing candle to close. This confirms whether it’s truly an engulfing pattern.
- Enter your trade:
- For bullish setups → Enter when the next candle closes above the engulfing candle’s high.
- For bearish setups → Enter when the next candle closes below the engulfing candle’s low.
- Set your Stop Loss (SL):
- For bullish setups → Place SL just below the engulfing candle’s low.
- For bearish setups → Place SL just above the engulfing candle’s high.
- Set your Take Profit (TP):
Aim for at least a 2:1 risk-to-reward ratio or more, depending on market conditions.
Final Thoughts
The engulfing candlestick chart pattern is a reliable tool when used in the right context, such as at strong support or resistance levels, valid order blocks, or trendline touches. Don’t rely on it in isolation; instead, combine it with other technical confluences for higher accuracy.
Remember, trading is about probabilities. Always use proper risk management and never depend on a single candlestick pattern for entry.
If you have further questions about the engulfing candlestick pattern, feel free to drop them in the comments section. See you in the next session!





2 Comments
Wow! this is stunning.
We appreciate!