Effective Ways to Use the RSI Indicator in Forex Trading (Complete Guide)
In this session, we’ll be exploring one of the most powerful tools in technical analysis, “the Relative Strength Index (RSI).”
Whether you’re a beginner or an experienced trader, understanding how to use RSI correctly can transform your approach to the market. However, it’s not just about adding it to your chart; it’s about knowing how to interpret, confirm, and execute using RSI signals.
Let’s dive deep into the world of RSI, uncovering how professionals use it to gain an edge in the forex market.
What is the Relative Strength Index (RSI)?
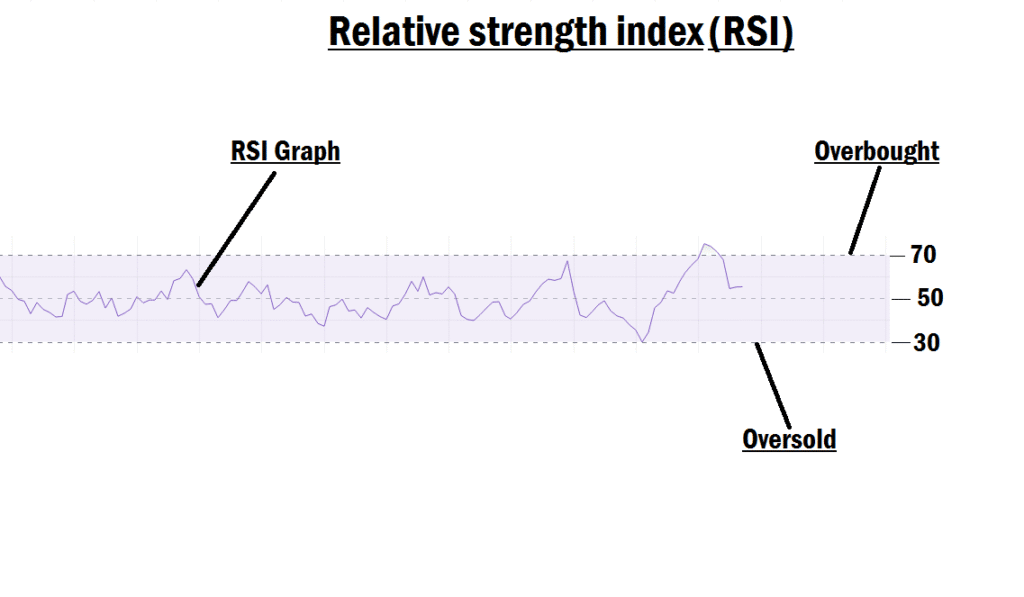
The Relative Strength Index (RSI) is a momentum oscillator developed by J. Welles Wilder Jr. that measures the speed and change of price movements. It oscillates between 0 and 100, helping traders assess overbought and oversold conditions in the market.
- Above 70: Overbought (Price may be too high and a possible reversal downward could be expected)
- Below 30: Oversold (Price may be too low and a possible reversal upward could be expected)
- Between 30 and 70: Neutral momentum
Unlike trend indicators like moving averages, RSI focuses on momentum, making it ideal for spotting potential reversals, market exhaustion, and entry points during retracements.
The Psychology Behind RSI
RSI reflects trader behavior and market psychology:
- Overbought (70–100): At this point, the market has experienced a surge in buying. Many traders may start taking profit. It doesn’t mean the market will reverse immediately, but it signals that upward momentum might be weakening.
- Oversold (0–30): Here, selling pressure has dominated, pushing price down. Buyers may begin entering the market, anticipating a reversal or correction.
But here’s the biggest mistake most beginners make:
They enter trades just because RSI hits 70 or 30, without further confirmation. This approach is dangerous, especially in trending markets where price can remain overbought or oversold for long periods.
How RSI Is Calculated
Let’s break it down for a better understanding:
RSI = 100 – (100 / (1 + RS))
Where:
RS = Average Gain over a specific period / Average Loss over the same period
The default period is 14.
Let’s say over the last 14 periods, price gained for 10 candles and lost for 4. The indicator compares those gains and losses and plots the result as a percentage between 0 and 100.
It provides insight into how strong recent price action is, relative to its historical performance.
Why Many Traders Lose With RSI
The problem isn’t the indicator, it’s how people use it.
- Blindly entering trades at 70 or 30
- Using it alone without confirmation
- Ignoring the market context or trend strength
For example, in a strong uptrend, the RSI can remain above 70 for an extended period without the price reversing. Traders who short at 70 thinking the price must fall are often stopped out or liquidated.
The truth?
RSI works best when used as part of a comprehensive strategy, rather than in isolation.
How to Use RSI Like a Professional Trader
Let’s now dive into pro-level strategies for using RSI effectively:
1. Multi-Time Frame Confirmation
It is one of the most important techniques.
Instead of relying on one time frame, compare RSI readings across multiple time frames to increase the accuracy of your signals. Use the lower time frame for entry and the relatively higher time frame for overbought or oversold confirmation.
For example:
- Entry Time Frame: 1-minute
- Relative higher Time Frame: 3-minute
- Entry Time Frame: 5-minute
- Relative higher Time Frame: 15-minute
- Entry Time Frame: 15-minute
- Relative higher Time Frame: 1-hour
Why this works:
If RSI is oversold on your entry time frame, but the higher time frame is still in a bullish or neutral zone, it’s likely just a small retracement and not a true reversal.
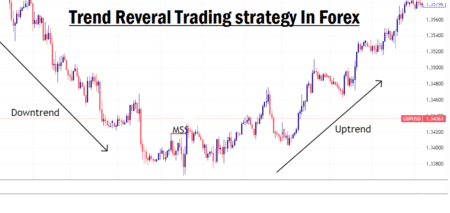
Wait until both your entry and relatively higher time frames indicate oversold or overbought, then look for an entry if you spot a clear shift in market structure (MSS) at your entry time frame.
2. Look for Price Action Confirmation
Never enter a trade based on RSI alone. Wait for confirmation from:
- Market Structure Shift (e.g., break of trendline or key level)
- Candlestick Patterns (e.g., bullish/bearish engulfing)
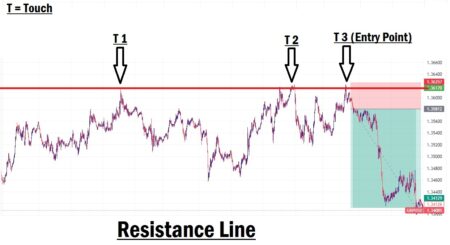
- Support/Resistance zones
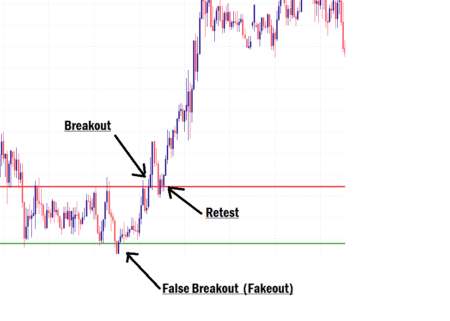
- Liquidity sweeps (false breaks of highs/lows)
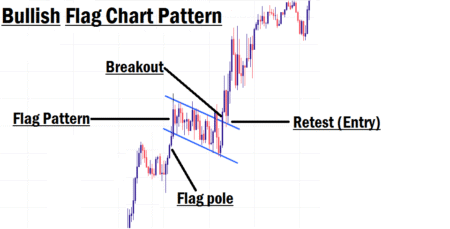
- Break and retest
For example, if RSI shows oversold, wait for a bullish engulfing candle at a demand zone or order block before entering.
3. Combine RSI With Institutional Concepts
It is where most retail traders fall short; they ignore smart money behavior.
Use RSI in combination with institutional reference points like:
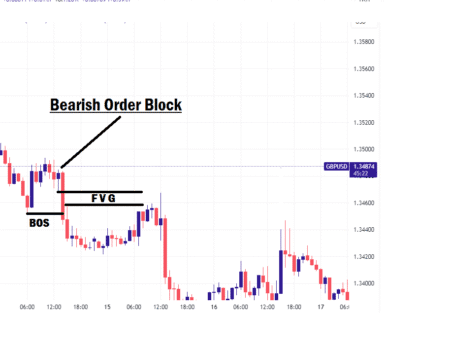
- Order Blocks
- Fair Value Gaps
- Breaker Blocks
- Liquidity Pools
Let’s say price hits oversold on RSI while returning to a bullish order block on your 15-minute chart. Then on the 5-minute chart, look for a bullish engulfing candle and a break of market structure.
That’s a high-probability, smart money-confirmed setup.
4. Avoid Using RSI in Strong Trends Without Support
In strong uptrends or downtrends, RSI can stay in overbought/oversold zones for long. In these cases:
- Switch to trend-following strategies
- Use RSI for pullbacks within the trend
- Enter on retracements when RSI returns from extreme levels to demand or supply zones.
Example RSI Strategy
Here’s how to trade RSI correctly in a real scenario:
- You’re on the 1-minute chart, and RSI hits oversold (below 30)
- You check the 3-minute chart: RSI is also approaching oversold
- Identify a bullish order block at this zone
- Wait for a bullish engulfing candle to form on the 1-minute chart
- Enter a buy position, with your stop-loss below the order block


It is a confluence-based setup; multiple factors align, making it a high-quality trade.
How to Get the RSI Indicator on Your Chart
Almost every charting platform provides the RSI by default. Here’s how to add it:
On TradingView:
- Click on the “Indicators” tab at the top
- Search for “Relative Strength Index.”
- Click to add it to your chart
- Leave the default setting (14) for most strategies
On MetaTrader 4/5:
- Go to Insert > Indicators > Oscillators > Relative Strength Index
- Set the period to 14 (or custom if needed)
Important Reminders Before Using RSI in Live Trading
- RSI is not a guarantee; it works on probabilities, not certainties, just like every other strategy
- Practice on a demo account first before using real money
- Don’t rely on RSI alone. Use structure, confluence, and confirmation
- Risk management is key; protect your capital with proper lot sizing and stop-loss
- Patience and discipline are your biggest edges
Final Thoughts
The Relative Strength Index (RSI) is a trusted and effective trading tool, but only when used correctly. Mastering RSI can give you clearer insights into market momentum, help you avoid false signals, and improve your trade entries significantly.
The secret lies in:
- Multi-time frame confirmation
- Combining with smart money concepts
- Waiting for clear price action signals
- Practicing consistently in demo mode
Master it, and you’ll turn the RSI into one of your most profitable tools in forex trading.
Coming up next:
“How to Trade Forex News Events With Precision.”
Don’t miss it, we’re diving into the heart of volatility!

