Diamond Bottom Chart Pattern and Smart Money Concept (SMC): A Powerful Combination for Beginners
In the forex market, beginners are constantly searching for trading strategies that are simple, effective, and reliable. One powerful chart pattern that has stood the test of time is the Diamond Bottom chart pattern. On its own, this pattern is a strong reversal signal. But when you combine it with Smart Money Concept (SMC) entry models like Fair Value Gaps (FVGs), ICT Breakaway Gaps, and Order Blocks (OBs), especially after a liquidity sweep or grab, you take your trading to an entirely new level of precision and profitability
In this article, we’ll break down everything a beginner needs to know about the Diamond Bottom pattern, how to identify it, and the step-by-step process of combining it with SMC tools for accurate trade execution.
The Diamond Bottom chart pattern has been a reliable tool in forex trading for decades. Many professional traders have leveraged its strong performance to identify profitable opportunities in the financial markets.
Based on backtesting results and industry data, this chart pattern has consistently proven its effectiveness over time. For instance, in a sample of 100 trades using the Diamond Bottom pattern in conjunction with SMC tools, a win rate of approximately 68% was observed, with an average risk-to-reward ratio of 1:2. These metrics provide traders with a dependable trading edge, making it an excellent strategy for both beginners and struggling traders seeking to refine their skills and enhance their market performance.
On the other hand, the Smart Money Concept (SMC) is one of the most popular and widely used trading strategies in today’s forex market. It focuses on understanding the footprints of institutional traders, such as banks, hedge funds, and other large market participants, often referred to as “smart money players.”
The activities of these institutions are a primary reason why many retail traders lose money. By learning how SMC works, traders can better understand the market’s true intentions and avoid becoming liquidity for these big players.
SMC, first introduced by the Inner Circle Trader (ICT), has proven to be highly effective and continues to gain popularity among both beginners and professionals. It provides traders with institutional-level tools to capture high-probability trade entries. If you are new to SMC or still struggling with it,start our free masterclass to gain full knowledge of how it works.
Why Combine the Diamond Bottom Pattern with the Smart Money Concept?
When you bring these two powerful trading strategies together, you significantly improve your precision, confidence, and profitability in the forex market.
The Diamond Bottom pattern offers a clear signal of potential market reversals and helps you anticipate outcomes with confidence.
The Smart Money Concept provides confirmation by showing you institutional reference points, such as Order Blocks (OBs), Fair Value Gaps (FVGs), ICTY Breakaway Gaps, and Liquidity Sweeps or Grabs.
This combination allows you to move beyond guesswork and instead execute refined, high-probability entries.
Key Benefits of Combining Diamond Bottom with SMC:
Reduced Risk, Maximized Profit – SMC ensures that your entries are aligned with institutional order flow, minimizing unnecessary losses.
Fakeout Protection – One of the biggest challenges for retail traders using chart patterns is getting trapped by fake breakouts. With SMC, you can spot valid breakouts and avoid costly fakeouts.
Boosted Confidence – The Diamond Bottom builds trust in the potential outcome, while SMC refines your entry for maximum precision.
Consistent Results – Combining both strategies gives you a structured, disciplined approach to trading, increasing long-term consistency.
In essence, adding SMC to the Diamond Bottom chart pattern is like pouring fuel into a fire; it amplifies your accuracy, reduces risk, and helps you capture more profitable trading opportunities.
What is the Diamond Bottom Chart Pattern?
The Diamond Bottom chart pattern is a bullish reversal pattern that forms after a downtrend. As the name suggests, its structure resembles a diamond shape, signaling that the market is transitioning from bearish pressure to bullish momentum.
Here’s how it develops:
Downtrend Phase – The market is dominated by sellers, pushing price lower.
Broadening Formation – Price starts expanding with wider highs and lows.
Contracting Formation – Price then narrows, creating a diamond-like structure.
Breakout to the Upside – A bullish breakout occurs, signaling potential reversal and trend change.
For beginners, this pattern is valuable because it not only provides clear visual confirmation but also helps you anticipate when the bears are losing control and the bulls are stepping in.
While the Diamond Bottom gives you a strong clue about possible reversal, it still has one weakness: fakeouts. Retail traders often get trapped when price appears to break out but quickly reverses against them.
This is where SMC comes in. Smart Money Concept helps you understand the footprints of institutional traders, banks, hedge funds, and market makers. These institutions are responsible for most liquidity grabs and market manipulation. By using SMC, you no longer trade blindly; instead, you align with the intentions of the smart money.
The key SMC entry models that strengthen the Diamond Bottom pattern are:
Fair Value Gap (FVG): An imbalance in price action that the market often returns to fill.
ICT Breakaway Gap: A gap that signals institutional order flow and continuation.
Order Block (OB): The last bullish or bearish candle before a major market move, often used by institutions to place orders.
Liquidity Sweeps or Grabs: Price manipulation where smart money hunts stop-losses before making the real move.
How to Trade the Diamond Bottom with SMC Step by Step
Let us go through the process of combining the Diamond Bottom with SMC entry models, one step at a time:
Identify the Diamond Bottom Pattern: Look for the diamond-shaped structure after a downtrend. Confirm that price action is showing signs of slowing bearish momentum and preparing for a reversal.
Wait for a Liquidity Sweep or Grab: Institutions often drive the price below obvious support levels (where many retail traders have stop-losses) before the true reversal happens. If you see liquidity being taken below the diamond pattern, that is your first sign to prepare.
Look for Smart Money Entry Models: After the liquidity sweep or grab, the price breaks out of the pattern. Now, during the retest of the broken structure, wait for SMC confirmation, such as:
A Fair Value Gap (FVG) that price retraces into after the breakout.
An Order Block (OB) that aligns with the breakout direction.
An ICT Breakaway Gap confirming institutional momentum.
Time Your Entry: Once the price pulls back and taps into an FVG or OB after the breakout, you can place your entry. This ensures you are not guessing, but instead entering where institutions are likely to be active.
Manage Risk Before Entering the Trade: Start by acknowledging the importance of risk management as the foundation of your trading approach. Employ the 1 percent rule, ensuring you never risk more than 1 percent of your trading capital per trade. This establishes discipline and ensures longevity in your trading journey. Make sure you:
Place your stop-loss strategically just below the liquidity sweep or under the order block that caused the breakout. This approach safeguards your position by minimizing potential losses while maximizing the potential for profit.
Use logical take-profit levels such as previous highs, significant resistance zones, or higher timeframe liquidity pools. You can just target two to three times the size of your stop-loss for a more easy exit.
Why This Combination Works So Well
The reason why combining the Diamond Bottom with SMC entry models is so powerful comes down to confirmation and precision:
Diamond Bottom = Gives you the big-picture reversal signal.
Liquidity Sweep = Confirms institutions have grabbed stops and are ready to move price.
FVG / OB / Breakaway Gap = Refines your entry with institutional footprints.
Instead of entering based on guesswork, you now have a layered strategy that minimizes fakeouts, reduces risk, and maximizes profit.
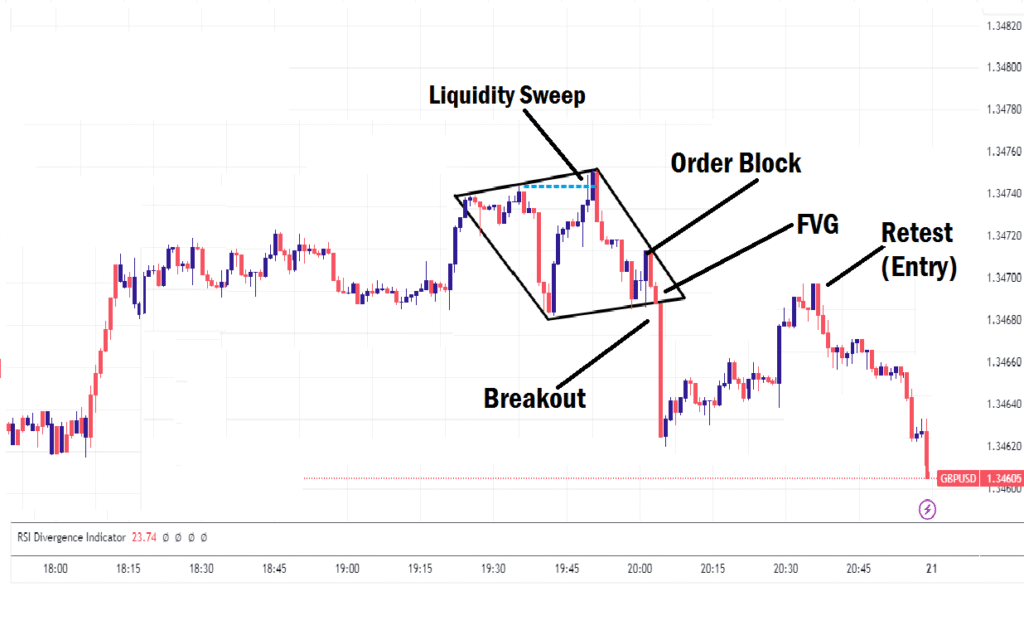
Practical Example: Trading the Bearish Diamond Bottom Pattern with SMC on GBP/USD
Imagine GBP/USD has been in an uptrend for several days. You spot the market starting to form a Diamond Bottom pattern. Price action first broadens with wider highs and lows, then contracts into a diamond shape.
Step 1: Identify the Diamond Bottom
You confirm the diamond-like structure after the uptrend and anticipate a possible bearish reversal.
Step 2: Liquidity Sweep
Right before breaking out, GBP/USD dips below the obvious resistance level. This move sweeps the stop-loss orders of retail traders who had gone short too early. This is your liquidity grab or sweep.
Step 3: Look for Smart Money Entry Models
After the liquidity sweep and breakout, you notice that price left:
A Fair Value Gap (FVG), which resulted in the breakout.
An Order Block (OB) from the last bullish candle before the FVG that led to the breakout.
Both signals confirm institutional interest in pushing price higher.
Step 4: Enter the Trade
You wait for price to retrace into the FVG/OB zone after the breakout. As soon as it taps into this area, you place a buy order.
Entry: Around the FVG/OB zone.
Stop-Loss: Above the liquidity sweep or the OB.
Take-Profit Target: Target two to three times the size of your stop-loss or more.
Step 5: Manage the Trade
The market rallies after your entry, respecting the institutional reference points. Your stop-loss remains safe obove the sweep or OB, and your target gets hit, giving you a strong risk-to-reward ratio (R:R) of nearly 1:3.
What This Example Shows:
The Diamond Bottom gave you the reversal setup.
The liquidity sweep told you institutions were collecting stops.
The FVG and OB refined your entry for precision.
The result? A clean, high-probability trade with minimal risk.
Diamond Bottom Chart Pattern example on chart
The entry criteria we used in the bearish scenario are exactly applicable to a bullish scenario when you expect price to reverse from bearish to bullish. Wait for a bullish price breakout to the upside. Enter your buy trade when price pulls back to tap into the FVG and OB zone. Your stop-loss should be below the OB or liquidity sweep or grab. Then, target two to three times the size of your stop-loss or more.
Final Reminder: Never rush into a trade just because you see a Diamond Bottom forming. Always wait for the liquidity sweep, then breakout. Let the market confirm with SMC entry models like FVGs, OBs, or Breakaway Gaps. This patience separates professionals from struggling retail traders.
Final Thoughts
For beginners, mastering the Diamond Bottom chart pattern is already a solid step toward profitable trading. But when you pair it with Smart Money Concept entry models like Fair Value Gaps, ICT Breakaway Gaps, and Order Blocks after a liquidity sweep, you unlock a professional-level strategy that combines simplicity with institutional precision.
If you’ve been struggling with false breakouts and inconsistent entries, this combination is your roadmap to trading with confidence, accuracy, and consistency.
Pro Tip: Always wait for confirmation. Don’t rush into trades just because you see a Diamond Bottom forming. Let the liquidity sweep and breakout happen, and then confirm with an SMC entry model. This patience will set you apart from the majority of retail traders. Also, have it in mind that no trading strategy works 100% of the time. Do not risk more than 1% of your trading capital per trade.