
1-Minute Forex Trading Scalping Strategy Using the RSI Indicator
Imagine turning every minute into an opportunity for trading success, capturing quick profits with a method that’s as straightforward as its effectiveness. Many beginners in forex trading are constantly seeking this kind of powerful 1-minute trading strategy to capitalize on rapid, profitable market moves. The challenge often lies in finding a strategy that is both easy to use and highly effective in real market conditions. This guide seeks to help you overcome the challenge.
In this guide, we will walk you step-by-step through how to use the Relative Strength Index (RSI) together with Order Blocks to find high-probability scalping entries.
After backtesting this strategy for six months on GBP/USD, GBP/JPY, and EUR/USD, the results were impressive, an 81% win rate using a 1:2 risk-to-reward ratio, and 73% win rate when stretched to 1:3. This strategy is designed for scalpers, traders who operate within the 1-minute timeframe, and it works beautifully when properly mastered through backtesting and forward testing.
⚠️ Important Disclaimer
Forex trading involves risk and is not suitable for everyone. Before trading live, make sure you backtest and forward test this strategy on a demo account. Never trade any strategy blindly. Master it first.
Understanding the RSI (Relative Strength Index)
The RSI is one of the most widely used and respected indicators in the forex world. It measures momentum in price movements, helping traders identify when price might be overbought, oversold, or manipulated.
Millions of traders use RSI to detect price momentum and divergence, which can reveal market manipulations and potential reversals. For this strategy, our focus is specifically on RSI Divergence, not momentum.
To add RSI to your chart, simply go to your trading platform’s indicator tab, search for “Relative Strength Index,” and click to install it. No additional settings are required unless if you wish to customize the look.
What Is RSI Divergence?
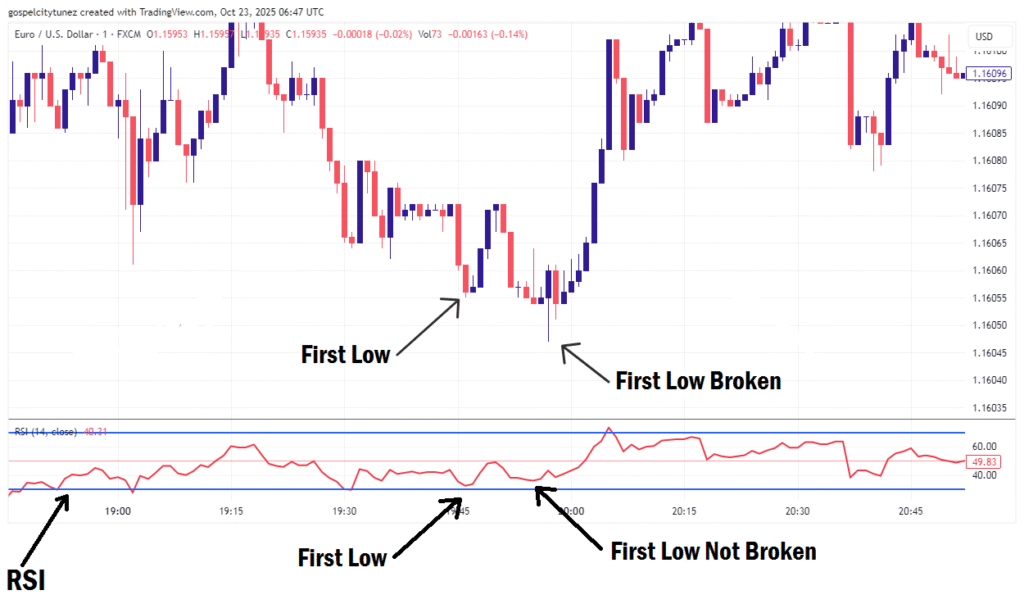
RSI Divergence occurs when the price reaches a new high or low, but the RSI fails to confirm this new high or low. This creates a disagreement between price and momentum, a sign that the move could be a liquidity grab or a form of market manipulation by institutional traders.
On your chart, price broke the previous low or high to form a new one. But in the RSI, price fails to break the previous low or high. That scenario is called an RSI divergence.
Here’s how to spot it:
- If price makes a new high or low on your chart, but RSI doesn’t follow suit, it signals that price manipulation may have occurred.
- When this divergence appears around a strong Order Block (OB), it’s a powerful indication that price may reverse from that zone.
Example:
Let’s say price taps into a bullish order block, forming a first low. Price later broke the first low and created a new one, but the RSI failed to break the first low and make a new low. If you see such, that is a bullish divergence. This tells you that institutional traders may have cleared liquidity before reversing price direction.
Let’s say price taps into a bullish order block, forming a first low. Price later broke the first low and created a new one, but the RSI failed to break the first low and make a new low. If you see such, that is a bullish divergence. This tells you that institutional traders may have cleared liquidity before reversing price direction.
Types of RSI Divergence
- Bearish Divergence:
Occurs when price makes a new high, but RSI makes a lower high. This signals weakening bullish momentum and a possible bearish reversal. - Bullish Divergence:
Occurs when price makes a new low, but RSI makes a higher low. This indicates fading bearish momentum and potential reversal to the upside.
Understanding Order Blocks
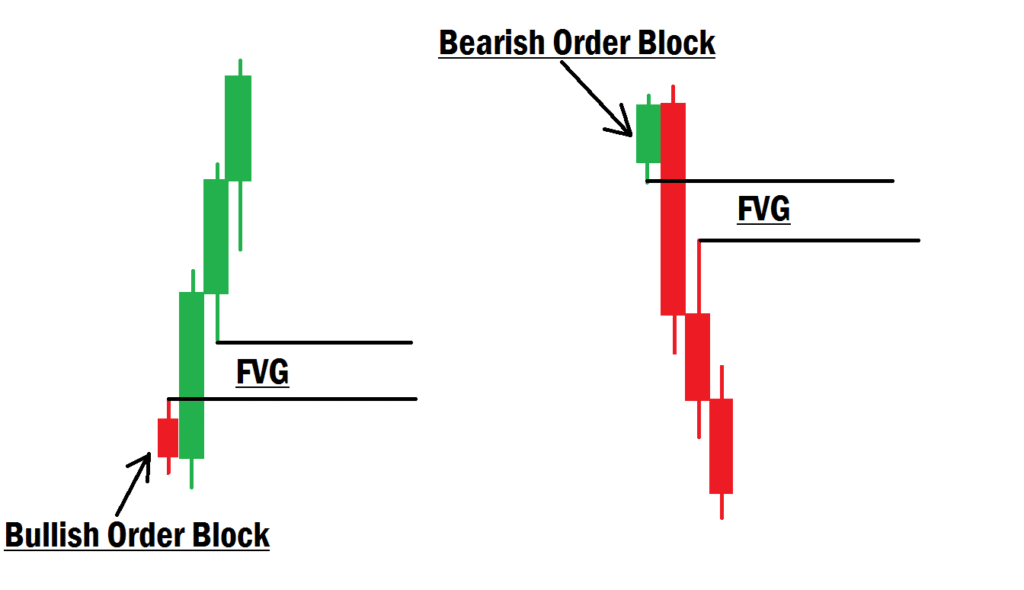
An Order Block (OB) represents areas where institutional traders have placed large buy or sell orders, causing significant price movement and creating an imbalance in the market, known as a Fair Value Gap (FVG).
Institutional traders often defend these areas, pushing price away once the imbalance is filled.
There are two main types of Order Blocks:
- Bullish Order Block:
The last bearish candlestick before an impulsive upward movement that breaks market structure or creates a shift in market direction. - Bearish Order Block:
The last bullish candlestick before a strong downward move that breaks market structure.
What Is a Fair Value Gap (FVG)?
A Fair Value Gap (FVG) is an imbalance in price delivery. It forms when, in a three-candle sequence, the wick of the third candlestick fails to touch the wick of the first, leaving a visible gap on the chart.
This FVG not only validates an order block but also enhances its effectiveness when used together in analysis.
How to Trade Using RSI and Order Blocks (1-Minute Strategy)
This RSI scalping strategy combines the 15-minute and 1-minute charts for the best results.
- On the 15-minute timeframe, identify and mark your order block and any associated FVG.
- Once that’s done, drop down to the 1-minute timeframe to watch for RSI divergence as price approaches the marked zone.
Entry Steps:
- Wait for price to tap into your marked Order Block or FVG zone.
- Look for a clear RSI divergence in that region.
- Once the last candlestick that forms the new high or low closes, enter your trade.
- Place your stop loss (SL) just below the order block zone.
- Set your take profit (TP) at 2x your stop loss size (1:2 RR).
Example Trade Setup
Suppose you’ve marked a bullish order block on the 15-minute timeframe. Then, on the 1-minute chart, you spot a bullish RSI divergence as price taps into your zone.
Once the last divergence candle closes, you enter a buy trade, set your stop loss below the order block, and target twice the risk as your take profit.
This simple setup allows you to scalp efficiently with high precision and discipline.
Final Thoughts
Order blocks alone may fail sometimes, but when combined with RSI divergence, your trades become far more powerful and reliable.
Divergence near key levels is one of the strongest price reversal confirmations in trading. Always remember:
No divergence = No trade.
No divergence = No trade.
This approach works best on GBP/USD and EUR/USD, where volatility and liquidity are high enough to deliver consistent scalping opportunities.
If you have questions about this strategy or need further clarification, feel free to drop a comment below. Always trade with skills and confidence!


